October 31, 2025 a 01:15 pm
CARR: Trend and Support & Resistance Analysis - Carrier Global Corporation
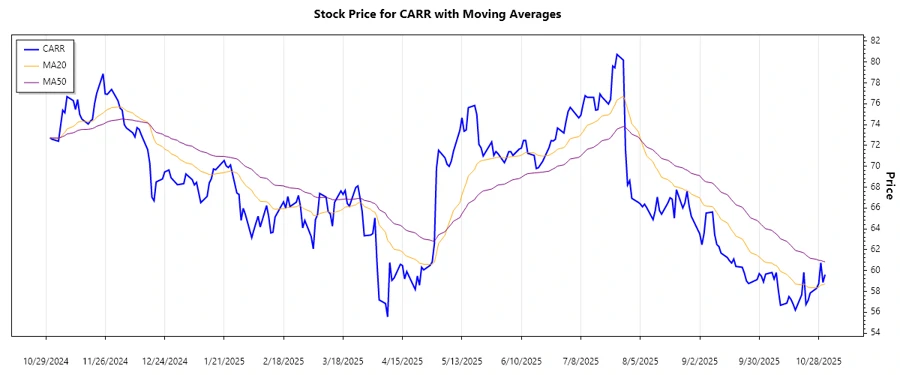
Carrier Global Corporation, a leader in HVAC and security solutions, has experienced diverse trends over the recent months. The provided price data indicates a dynamic and fluctuating stock performance. Notably, short-term trends and crucial support and resistance areas provide vital insights into the company's market behavior, helping analysts better evaluate its future potential. With a focus on EMA indicators and key pricing zones, this analysis seeks to guide investment decisions within this industry segment.
Trend Analysis
Based on the analysis of the daily closing prices, the stock has showcased a complex trajectory involving both bullish and bearish indicators. Calculating the EMA20 and EMA50 highlighted recent market dynamics, showing a prominent downward trend.
| Date | Closing Price | Trend |
|---|---|---|
| 2025-10-31 | $59.60 | ▼ |
| 2025-10-30 | $58.85 | ▼ |
| 2025-10-29 | $60.75 | ▲ |
| 2025-10-28 | $58.74 | ▼ |
| 2025-10-27 | $58.29 | ▼ |
| 2025-10-24 | $57.84 | ▼ |
| 2025-10-23 | $57.12 | ▼ |
From a technical perspective, the EMA20 remaining consistently below EMA50 underscores a predominant bearish trend over the past month. Investors are advised to approach cautiously as the current market sentiment leans toward negativity.
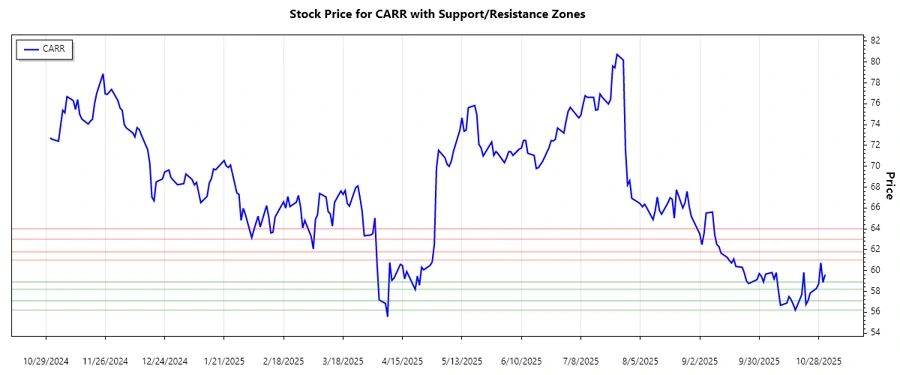
Support and Resistance
Upon reviewing recent price action, significant support and resistance levels have been identified. These levels are critical in assessing potential price rebounds or further declines.
| Zone | From | To | Direction |
|---|---|---|---|
| Support Zone 1 | $56.20 | $57.10 | 🟢 |
| Support Zone 2 | $58.20 | $58.90 | 🟢 |
| Resistance Zone 1 | $61.00 | $61.80 | 🔴 |
| Resistance Zone 2 | $63.00 | $64.00 | 🔴 |
The current stock price hovers near the upper boundary of Support Zone 2, suggesting a potential shift from bearish to bullish influence if upward pressure persists. However, the proximity to nearby resistance zones warrants vigilance.
Conclusion
The Carrier Global Corporation stock is amidst a downward trend with identifiable support and resistance zones that should guide investors’ strategies. Recent price drops suggest caution as the stock tests lower boundaries of pivotal support. However, a breach past resistance levels could reignite bullish sentiments. Analysts should closely monitor emerging indicators to assess market shifts. Opportunities and risks abound, given the current price action within strategic zones.
Smart Data Insight
Master the Perfect Entry & Exit for this Stock
Don't leave your profits to chance. Historically, this stock follows specific seasonal patterns that institutional traders use to maximize returns.
- ✅ Identify the "Golden Buying Window"
- ✅ Avoid high-risk correction cycles
- ✅ Backtested data from the last 20+ years