February 26, 2026 a 06:44 am
CARR: Fibonacci Analysis - Carrier Global Corporation
The Carrier Global Corporation (CARR) has shown significant movements in the past months. Notably, the HVAC and building automation technologies offered by Carrier have contributed to its financial performance. This analysis addresses the recent pricing trend using Fibonacci retracement to understand potential support and resistance levels. As markets remain volatile, Carrier's diversified product offering provides cushioning, albeit challenges in the broader macro environment could pose risks.
Fibonacci Analysis
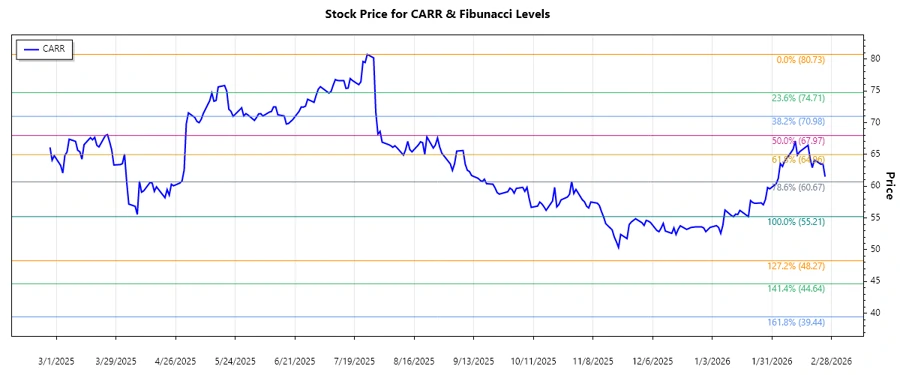
Analyzing the historical data for Carrier Global Corporation from November 2025 to February 2026 reveals a dominant downtrend. The downward swing starts at a high in July 2025 and reaches a low by the end of February 2026.
| Detail | Value |
|---|---|
| Start Date | 2025-07-25 |
| End Date | 2026-02-25 |
| High Price | $80.73 on 2025-07-25 |
| Low Price | $55.21 on 2026-01-20 |
| Current Price | $61.5 on 2026-02-25 |
Fibonacci Levels from the high of $80.73 to low of $55.21:
| Level | Price |
|---|---|
| 0.236 | $61.25 |
| 0.382 | $65.19 |
| 0.5 | $67.97 |
| 0.618 | $70.76 |
| 0.786 | $74.47 |
The current price of $61.5 is in close proximity to the 0.236 retracement level, suggesting potential testing of this zone. This level could signify short-term resistance.
Conclusion: If the price sustains above the 0.236 level, it might target higher retracements, potentially establishing new support. However, any break below could lead to further declines, revisiting recent lows.
Conclusion
Carrier Global Corporation is positioned in a challenging yet intriguing spot for investment. The technical analysis indicates a downtrend with emerging support around the 0.236 Fibonacci level. Given its diverse portfolio across HVAC, Refrigeration, and Fire & Security sectors, it has resilience potential against economic fluctuations. However, investors should remain cautious of global economic conditions that could affect demand. Analysts should watch for a sustained break above critical levels to affirm recovery or further declines as an entry point for long positions when considering strategic decisions.