October 16, 2025 a 06:45 am
CARR: Fibonacci Analysis - Carrier Global Corporation
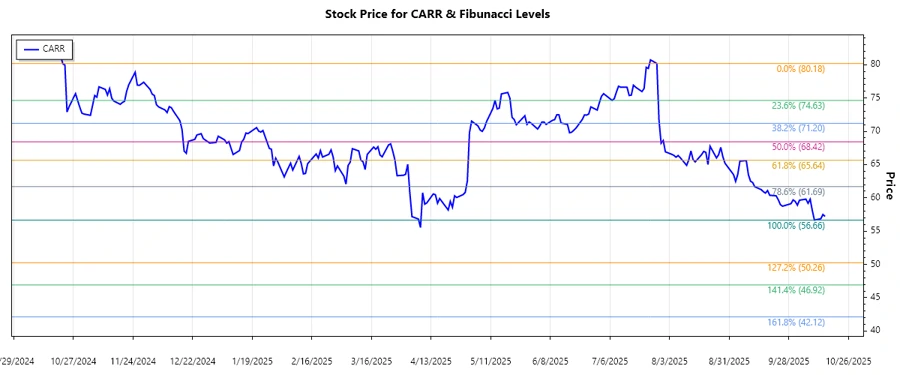
Carrier Global Corporation has seen significant market fluctuations driven by its diversified portfolio in HVAC, Refrigeration, and Fire & Security technologies. Recently, the stock has experienced a downward trend, positioning it as a possible value opportunity for long-term investors. The current analysis provides a technical overview to assess potential support levels and reversal zones using Fibonacci Retracement.
Fibonacci Analysis
The analysis spans a distinct downtrend period characterized by decreasing stock prices.
| Element | Details |
|---|---|
| Start Date | 2025-07-28 |
| End Date | 2025-10-15 |
| High Point | $80.18 on 2025-07-28 |
| Low Point | $56.66 on 2025-10-10 |
Fibonacci Levels
| Fibonacci Level | Price Level |
|---|---|
| 23.6% | $61.92 |
| 38.2% | $65.122 |
| 50% | $68.42 |
| 61.8% | $71.718 |
| 78.6% | $75.28 |
Current Price: $57.21 – The stock is below the 23.6% Fibonacci retracement level, suggesting it is currently in a weak position, but this level might act as a future resistance point. Analysts should consider these levels for potential rebounds.
Conclusion
The current downtrend presents both opportunities and risks for Carrier Global's stock. While we've witnessed a decline, this retracement analysis indicates potential resistance levels that could serve as pivot points for upward movements. If the stock manages to break through the 23.6% level, further gains might be possible. However, persistent trading below this level might suggest ongoing bearish sentiment. Investors should remain cautious but optimistic about any positive reversal signals.
Smart Data Insight
Master the Perfect Entry & Exit for this Stock
Don't leave your profits to chance. Historically, this stock follows specific seasonal patterns that institutional traders use to maximize returns.
- ✅ Identify the "Golden Buying Window"
- ✅ Avoid high-risk correction cycles
- ✅ Backtested data from the last 20+ years