September 20, 2025 a 04:45 pm

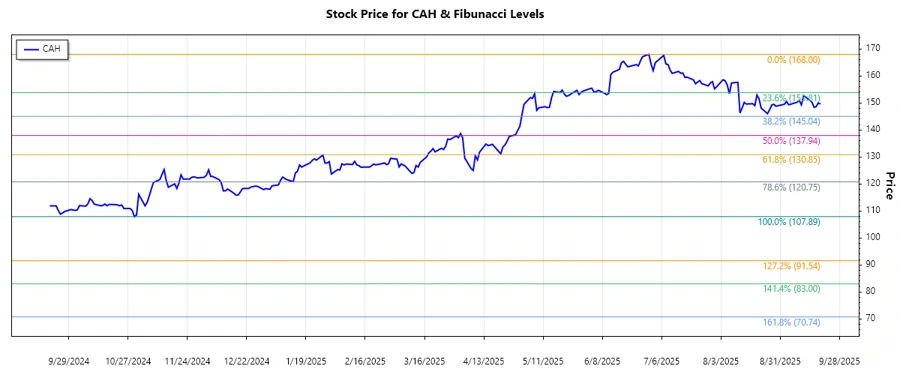
CAH: Fibonacci Analysis - Cardinal Health, Inc.
Cardinal Health, Inc. (CAH) stock has recently shown a dominant downtrend. This reflects concerns in the broader healthcare and pharmaceutical sectors, where market fluctuations have impacted Cardinal Health's performance. The company's strong foothold through its pharmaceutical and medical segments provides a buffer against market volatility. Investors should stay alert for potential upswings, given its resilient business model amid global healthcare demands.
Fibonacci Analysis
| Detail | Information |
|---|---|
| Trend | Dominant Downtrend |
| Start Date | 2024-12-31 |
| End Date | 2025-09-19 |
| High Point | $168.00 (2025-06-30) |
| Low Point | $107.89 (2024-10-30) |
Fibonacci Retracement Levels
| Level | Price |
|---|---|
| 0.236 | $120.71 |
| 0.382 | $130.98 |
| 0.5 | $137.95 |
| 0.618 | $144.92 |
| 0.786 | $152.87 |
The current price of $149.6 is within the 0.786 retracement level, indicating potential resistance around this area.
This level may act as a strong resistance, but if surpassed, it could signal a reversal or continuation in the trend.
Conclusion
Cardinal Health, Inc.'s stock showcases a notable downtrend, presenting both risks and opportunities. A strong resistance is visible at the 0.786 Fibonacci level, suggesting caution for bullish investors. If the stock manages to breach this level, it might indicate a possible trend reversal or a phase of consolidation. Analysts should keep an eye on forthcoming financial results and sector developments, as these could provide catalysts for movement. While the company's market position is stable, external market conditions and policy changes remain pivotal. The technical outlook suggests vigilance and preparedness for both continued declines or a surprising upward momentum. Long-term investors might consider current levels for strategic entry, factoring in potential downward pressures.
Smart Data Insight
Master the Perfect Entry & Exit for this Stock
Don't leave your profits to chance. Historically, this stock follows specific seasonal patterns that institutional traders use to maximize returns.
- ✅ Identify the "Golden Buying Window"
- ✅ Avoid high-risk correction cycles
- ✅ Backtested data from the last 20+ years