September 14, 2025 a 03:15 pm

CAH: Fibonacci Analysis - Cardinal Health, Inc.
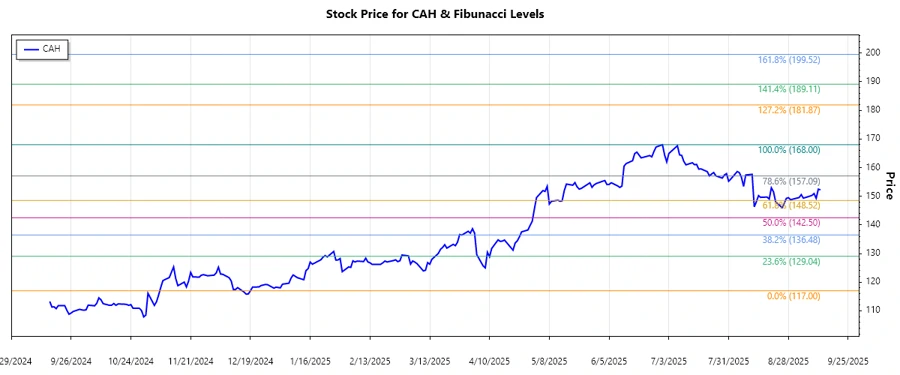
The stock of Cardinal Health, Inc. has shown noticeable volatility, yet reflects a steady recovery over the last several months. Initially, a significant downturn was seen, but since April, the stock has been on a gradual incline. The company's robust operations in the pharmaceutical and medical sectors contribute to its recovery and growth potential in the face of economic challenges.
Fibonacci Analysis
| Trend Analysis | Details |
|---|---|
| Start Date | 2024-12-30 |
| End Date | 2025-09-12 |
| High Point (Price & Date) | 168 on 2025-06-30 |
| Low Point (Price & Date) | 117 on 2024-11-05 |
| Fibonacci Levels |
|
The current price is hovering around 152.24, indicating it is slightly above the 0.786 retracement level. Technically, this may suggest a significant support level has been formed, leading to potential bullish momentum if prices hold or increase.
Conclusion
The Cardinal Health stock has shown resilience by recovering from its recent lows and setting a clear uptrend. This recent price action indicates underlying strength, potentially driven by the company's adaptive and diverse healthcare operations. However, should the price slip below established Fibonacci retracement levels, it may signal a potential reversal risk, warranting caution. For investors and analysts, the focus will remain on watching for sustainable price movements above the critical retracement levels as a continuation of positive momentum.
Smart Data Insight
Master the Perfect Entry & Exit for this Stock
Don't leave your profits to chance. Historically, this stock follows specific seasonal patterns that institutional traders use to maximize returns.
- ✅ Identify the "Golden Buying Window"
- ✅ Avoid high-risk correction cycles
- ✅ Backtested data from the last 20+ years