
June 28, 2026 a 07:31 am
CAH: Dividend Analysis - Cardinal Health, Inc.
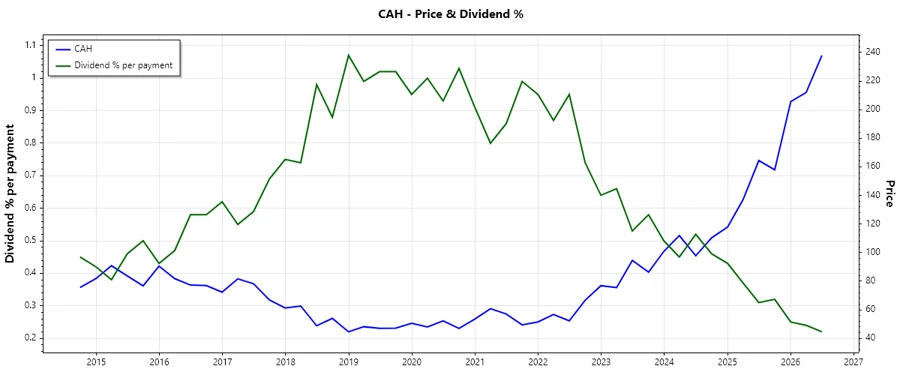
Cardinal Health, Inc. (ticker: CAH) has shown consistent dividend payments for the past 41 years, reflecting strong fiscal discipline. Despite its relatively low dividend yield of approximately 0.86%, its extensive history without suspensions underscores a reliable income stream for investors. However, investors should take note of the moderate payout ratios aligned with sustainable dividend policies, offering reassurance about the company's ability to maintain and possibly increase payouts in the long term.
📊 Overview
Cardinal Health operates in a stable sector, offering moderate dividends with a history of no cuts in 41 years. With a current dividend per share of $2.05, the sustainability corresponds to the sector’s average, motivating potential investors to consider long-term holds.
| Metric | Value |
|---|---|
| Sector | Healthcare |
| Dividend yield | 0.86% |
| Current dividend per share | $2.05 USD |
| Dividend history | 41 years |
| Last cut or suspension | None |
🗣️ Dividend History
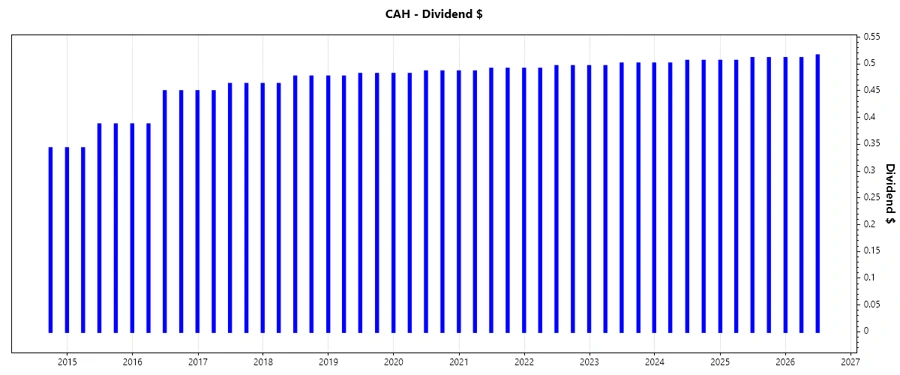
Cardinal Health's robust dividend history over 41 consecutive years demonstrates management's commitment to return capital to shareholders, a crucial consideration for income-focused investors.
| Year | Dividend Per Share |
|---|---|
| 2026 | $1.54 |
| 2025 | $2.03 |
| 2024 | $1.51 |
| 2023 | $2.00 |
| 2022 | $1.98 |
📈 Dividend Growth
Although the average yearly dividend growth of 0.95% over five years suggests limited immediate yields, the consistent escalation implies resilience, benefiting investors seeking stability.
| Time | Growth |
|---|---|
| 3 years | 0.91% |
| 5 years | 0.95% |
The average dividend growth is 0.95% over 5 years. This shows moderate but steady dividend growth.
⚖️ Payout Ratio
A payout ratio based on EPS of 30.90% presents a cautious approach, empowering Cardinal Health to reinvest significantly while returning value to shareholders. Furthermore, a free cash flow payout ratio of 10.93% indicates a solid cushion for dividend distributions.
| Key figure | Ratio |
|---|---|
| EPS-based | 30.90% |
| Free cash flow-based | 10.93% |
Cashflow & Capital Efficiency
Examining key cash flow and capital efficiency metrics reveals the strength of Cardinal Health's financial foundation, crucial for handling market shifts without jeopardizing operations.
| Metric | 2025 | 2024 | 2023 |
|---|---|---|---|
| Free Cash Flow Yield | 4.57% | 13.57% | 9.57% |
| Earnings Yield | 3.86% | 3.56% | 1.34% |
| CAPEX to Operating Cash Flow | 22.82% | 13.58% | 16.91% |
| Stock-based Compensation to Revenue | 0.18% | 0.05% | 0.05% |
| Free Cash Flow / Operating Cash Flow Ratio | 77.18% | 86.42% | 83.09% |
Balance Sheet & Leverage Analysis
The balance sheet's assessment highlights Cardinal Health's stable financial architecture, allowing for competitive positioning even with existing leverage.
| Metric | 2025 | 2024 | 2023 |
|---|---|---|---|
| Debt-to-Equity | -3.36 | -1.75 | -1.75 |
| Debt-to-Assets | 17.59% | 12.43% | 11.94% |
| Debt-to-Capital | 142.37% | 234.10% | 233.36% |
| Net Debt to EBITDA | 1.76 | 0.24 | 0.76 |
| Current Ratio | 0.94 | 0.98 | 1.00 |
| Quick Ratio | 0.50 | 0.56 | 0.52 |
| Financial Leverage | -19.10 | -14.04 | -14.65 |
Fundamental Strength & Profitability
Analysing profitability ratios provides wealth metrics reflecting the income efficiency realised by assets, suggesting inherent operational strategy strengths.
| Metric | 2025 | 2024 | 2023 |
|---|---|---|---|
| Return on Equity | -56.13% | -26.52% | -11.16% |
| Return on Assets | 2.94% | 1.89% | 0.76% |
| Net Margin | 0.70% | 0.38% | 0.16% |
| EBIT Margin | 1.04% | 0.55% | 0.36% |
| EBITDA Margin | 1.40% | 0.86% | 0.70% |
| Gross Margin | 3.67% | 3.27% | 3.36% |
| Research & Development to Revenue | 0% | 0% | 0% |
Price Development
🔢 Dividend Scoring System
| Criteria | Score | Score Bar |
|---|---|---|
| Dividend yield | 2 | |
| Dividend Stability | 5 | |
| Dividend growth | 3 | |
| Payout ratio | 4 | |
| Financial stability | 3 | |
| Dividend continuity | 5 | |
| Cashflow Coverage | 4 | |
| Balance Sheet Quality | 3 |
Total Score: 29/40
Rating
Overall, Cardinal Health provides a stable investment option characterized by solid dividend history and reasonable payout ratios, although with modest growth potential. This consistency, alongside established financial practices, justifies a “Hold” recommendation for long-term dividend-focused portfolios.
Smart Data Insight
Master the Perfect Entry & Exit for this Stock
Don't leave your profits to chance. Historically, this stock follows specific seasonal patterns that institutional traders use to maximize returns.
- ✅ Identify the "Golden Buying Window"
- ✅ Avoid high-risk correction cycles
- ✅ Backtested data from the last 20+ years