May 21, 2026 a 03:31 am

CAH: Dividend Analysis - Cardinal Health, Inc.
Cardinal Health, Inc. demonstrates a stable and enduring dividend profile. With a history of 41 years of dividend distributions, it reflects a commitment to returning value to shareholders. However, the current dividend yield is relatively modest. Despite some fluctuations, recent dividend growth suggests resilience, though challenges remain within the financial metrics, necessitating close monitoring.
📊 Overview
Cardinal Health, Inc. operates in the Healthcare sector and provides a dividend yield of 1.03%. The current dividend per share stands at 2.05 USD, bolstered by an impressive dividend history of 41 years. The company hasn't witnessed any recent dividend cuts or suspensions, highlighting its reliability and financial strength.
| Metric | Value |
|---|---|
| Sector | Healthcare |
| Dividend yield | 1.03% |
| Current dividend per share | 2.05 USD |
| Dividend history | 41 years |
| Last cut or suspension | None |
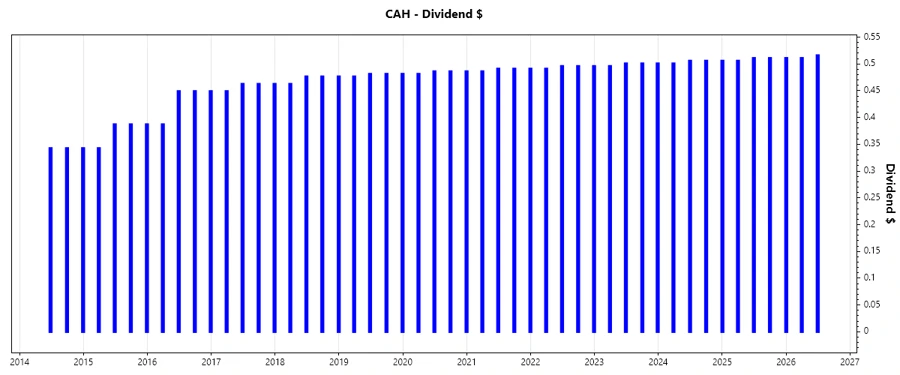
🗣️ Dividend History
Maintaining a consistent dividend history is a crucial indicator of a company's long-term health and shareholder commitment. With no dividend cuts or suspensions in recent memory, Cardinal Health, Inc.'s track record offers an assurance difficult to overlook by dividend-seeking investors.
| Year | Dividend per Share (USD) |
|---|---|
| 2026 | 1.54 |
| 2025 | 2.03 |
| 2024 | 1.51 |
| 2023 | 2.00 |
| 2022 | 1.98 |
📈 Dividend Growth
Analyzing the dividend growth over extended periods can help investors understand a company's ability to increase payouts through varying market conditions. The growth in dividends over the past several years reflects Cardinal Health's ongoing ability to adapt and thrive financially.
| Time | Growth |
|---|---|
| 3 years | 0.91% |
| 5 years | 0.95% |
The average dividend growth is 0.95% over 5 years. This shows moderate but steady dividend growth.
⚠️ Payout Ratio
Payout ratios are vital for assessing the sustainability of a company's dividend. With an EPS payout ratio of 30.90% and a FCF payout ratio of 10.93%, Cardinal Health showcases a conservative approach towards dividend payouts. These figures suggest ample room to continue dividends in the future, ensuring investor confidence even in earnings downswings.
| Key figure ratio | Value |
|---|---|
| EPS-based | 30.90% |
| Free cash flow-based | 10.93% |
The EPS and FCF payout ratios reflect a disciplined and prudent fiscal management strategy, maintaining a solid balance between rewarding shareholders and preserving capital.
💸 Cashflow & Capital Efficiency
Cardinal Health's cash flow and capital efficiency metrics provide insights into its financial health and operational prowess. The performance in these areas is crucial for supporting ongoing dividend payments and strategic investment opportunities.
| Metric | 2025 | 2024 | 2023 |
|---|---|---|---|
| Free Cash Flow Yield | 4.57% | 13.57% | 9.57% |
| Earnings Yield | 3.86% | 3.56% | 1.34% |
| CAPEX to Operating Cash Flow | 22.82% | 13.58% | 16.91% |
| Stock-based Compensation to Revenue | 0.11% | 0.05% | 0.05% |
| Free Cash Flow / Operating Cash Flow Ratio | 77.18% | 86.42% | 83.09% |
The cash flow data indicate stable cash generation capabilities, crucial for sustaining dividends and providing capital for growth initiatives without compromising financial health.
🔎 Balance Sheet & Leverage Analysis
Understanding Cardinal Health's balance sheet and leverage dynamics offers a clear picture of the company's financial stability and risk profile. Monitoring these metrics is essential for evaluating long-term viability and investment attractiveness.
| Metric | 2025 | 2024 | 2023 |
|---|---|---|---|
| Debt-to-Equity | -3.36 | -1.75 | -1.75 |
| Debt-to-Assets | 17.59% | 12.43% | 11.94% |
| Debt-to-Capital | 142.37% | 234.10% | 233.36% |
| Net Debt to EBITDA | 1.76 | 0.24 | 0.76 |
| Current Ratio | 0.94 | 0.98 | 1.00 |
| Quick Ratio | 0.50 | 0.56 | 0.52 |
| Financial Leverage | -19.10 | -14.04 | -14.65 |
While the highly leveraged structure indicates potential risks, the effective management of these figures ensures Cardinal Health maintains operational scalability and meets its financial obligations.
🎯 Fundamental Strength & Profitability
Evaluating fundamental strength and profitability involves assessing operational efficiency and financial health. These metrics guide investors on the potential for growth and earnings sustainability at Cardinal Health.
| Metric | 2025 | 2024 | 2023 |
|---|---|---|---|
| Return on Equity | -56.13% | -26.52% | -11.16% |
| Return on Assets | 2.94% | 1.89% | 0.76% |
| Net Margin | 0.70% | 0.38% | 0.16% |
| EBIT Margin | 1.04% | 0.55% | 0.36% |
| EBITDA Margin | 1.40% | 0.86% | 0.70% |
| Gross Margin | 3.67% | 3.27% | 3.36% |
| Research & Development to Revenue | 0% | 0% | 0% |
Overall, Cardinal Health displays modest profitability, with room for improvement. The attention to margins and returns is advisable for bolstering future financial outcomes.
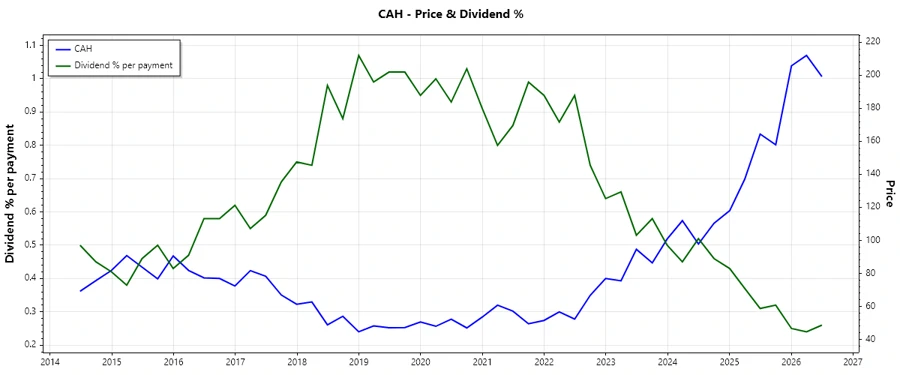
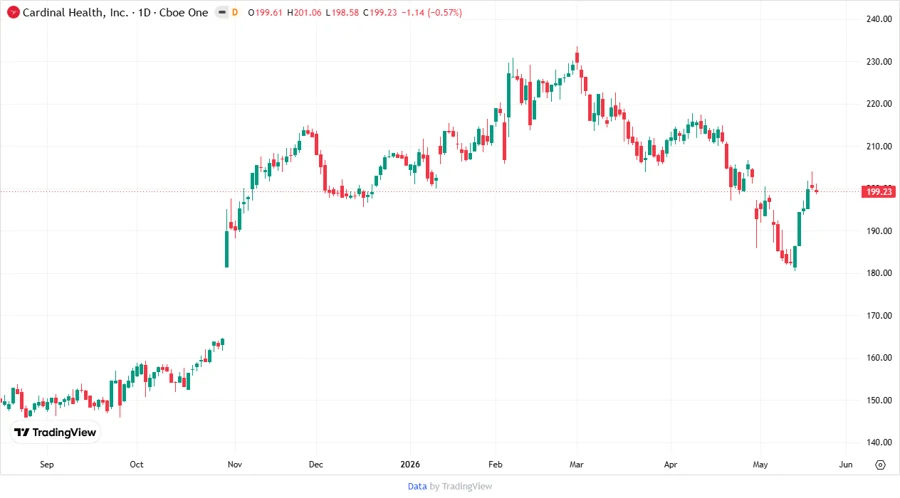
📉 Price Development
✅ Dividend Scoring System
| Criterion | Score | Visualization |
|---|---|---|
| Dividend yield | 2 | |
| Dividend Stability | 4 | |
| Dividend growth | 2 | |
| Payout ratio | 5 | |
| Financial stability | 3 | |
| Dividend continuity | 4 | |
| Cashflow Coverage | 3 | |
| Balance Sheet Quality | 3 |
Total Score: 26/40
🏆 Rating
Overall, Cardinal Health, Inc. exhibits a sound dividend strategy with scope for returns while maintaining a fundamentally robust position. The relatively low dividend yield and moderate growth rates might be a concern, yet the strong payout ratio and financial prudence provide a solid base. Investors seeking stable, long-term dividends may find Cardinal Health, Inc. appealing, albeit with an eye on the potential need for operational enhancements.
Smart Data Insight
Master the Perfect Entry & Exit for this Stock
Don't leave your profits to chance. Historically, this stock follows specific seasonal patterns that institutional traders use to maximize returns.
- ✅ Identify the "Golden Buying Window"
- ✅ Avoid high-risk correction cycles
- ✅ Backtested data from the last 20+ years