
February 24, 2026 a 03:31 am


CAH: Dividend Analysis - Cardinal Health, Inc.
Cardinal Health, Inc., an established player in the healthcare sector, boasts a remarkable 41-year dividend history. The company's consistent dividend payments reflect its commitment to returning value to shareholders. With a current dividend yield of approximately 0.91%, and moderate growth prospects, investors seek both stability and gradual appreciation in their investments within the healthcare segment. However, careful consideration of the financial metrics such as payout ratios and cash flow is imperative for making informed investment decisions.
📊 Overview
As a prominent company in the healthcare sector, Cardinal Health provides investors with an alluring dividend profile that emphasizes stability and reliability.
| Metric | Details |
|---|---|
| Sector | Healthcare |
| Dividend Yield | 0.91% |
| Current Dividend Per Share | 2.05 USD |
| Dividend History | 41 years |
| Last Cut or Suspension | None |
🗣️ Dividend History
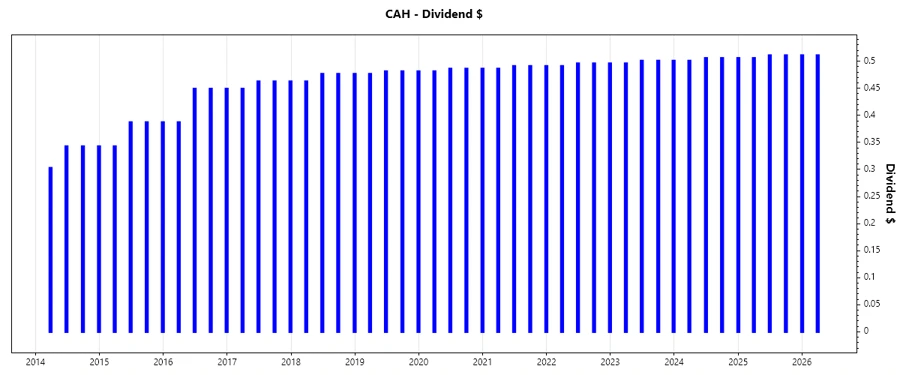
Cardinal Health's unwavering commitment over 41 years of continuous dividend history emphasizes its dedication to shareholder value, reassuring long-term investors of financial soundness.
Chart illustrating dividend history over the years.
| Year | Dividend Per Share (USD) |
|---|---|
| 2026 | 1.0214 |
| 2025 | 2.0326 |
| 2024 | 1.5118 |
| 2023 | 1.9975 |
| 2022 | 1.9779 |
📈 Dividend Growth
A moderate trajectory of growth in dividends pervades Cardinal Health's profile, vital for maintaining purchasing power over time and adapting to inflationary pressures.
| Time | Growth |
|---|---|
| 3 years | 0.91% |
| 5 years | 0.95% |
The average dividend growth is 0.95% over 5 years. This shows moderate but steady dividend growth.
Illustration of the company's dividend growth rates over recent years.
✅ Payout Ratio
The payout ratios provide insights into Cardinal Health's flexibility in maintaining dividends against earnings and cash flow fluctuations, crucial for sustainable payouts.
| Key figure | Ratio |
|---|---|
| EPS-based | 29.04% |
| Free cash flow-based | 8.76% |
The EPS-based payout ratio of 29.04% coupled with a free cash flow payout ratio of 8.76% reflects a conservative approach, suggesting manageable dividend payments within earnings and cash flow capabilities.
📉 Cashflow & Capital Efficiency
A comprehensive analysis of cash flow and capital ratios reveals Cardinal Health's adeptness at resource utilization, impacting future investments, and sustained dividend payments.
| Metric | 2025 | 2024 | 2023 |
|---|---|---|---|
| Free Cash Flow Yield | 0.046 | 0.136 | 0.096 |
| Earnings Yield | 0.039 | 0.036 | 0.013 |
| CAPEX to Operating Cash Flow | 0.229 | 0.136 | 0.169 |
| Stock-based Compensation to Revenue | 0.0011 | 0.0005 | 0.0005 |
| Free Cash Flow / Operating Cash Flow Ratio | 0.772 | 0.864 | 0.831 |
The stability in free cash flow and respectable earnings yield corroborates Cardinal Health's ability for strategic reinvestments and securing robust capital returns.
🗣️ Balance Sheet & Leverage Analysis
Evaluating the balance sheet and leverage unveils vital data on Cardinal Health's debt management and liquidity sufficiency critical for long-term financial health.
| Metric | 2025 | 2024 | 2023 |
|---|---|---|---|
| Debt-to-Equity | -3.36 | -1.75 | -1.75 |
| Debt-to-Assets | 0.176 | 0.124 | 0.119 |
| Debt-to-Capital | 1.424 | 2.341 | 2.334 |
| Net Debt to EBITDA | 1.93 | 0.243 | 0.764 |
| Current Ratio | 0.935 | 0.979 | 1.000 |
| Quick Ratio | 0.502 | 0.559 | 0.522 |
| Financial Leverage | -19.10 | -14.04 | -14.65 |
Despite negative debt-to-equity, the healthy cash/quick ratios highlight significant liquidity, ensuring a balance across liabilities and promoting financial resilience.
📈 Fundamental Strength & Profitability
Probing into fundamental metrics and profitability ratios shed light on Cardinal Health's operational efficiency and earning robust returns from capital invested.
| Metric | 2025 | 2024 | 2023 |
|---|---|---|---|
| Return on Equity | -0.561 | -0.265 | -0.112 |
| Return on Assets | 0.029 | 0.019 | 0.008 |
| Net Margin | 0.007 | 0.004 | 0.002 |
| EBIT Margin | 0.010 | 0.006 | 0.004 |
| EBITDA Margin | 0.014 | 0.009 | 0.007 |
| Gross Margin | 0.037 | 0.033 | 0.034 |
| R&D to Revenue | 0.000 | 0.000 | 0.000 |
The ROA and ROE figures present challenges due to negative equity values; however, prudent management in operational margins fosters a competitive edge over peers.
📉 Price Development
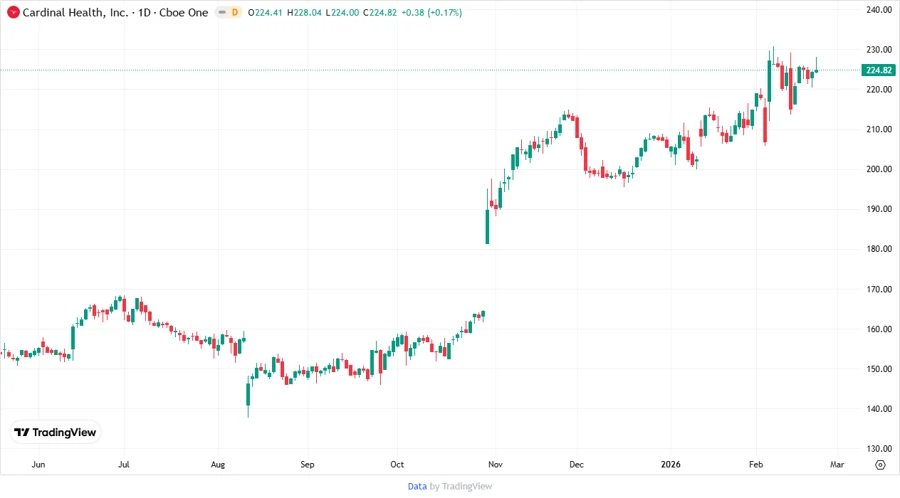
A graphical representation denoting the price movements of Cardinal Health stock.
🎯 Dividend Scoring System
| Category | Score | |
|---|---|---|
| Dividend Yield | 3 | |
| Dividend Stability | 4 | |
| Dividend Growth | 3 | |
| Payout Ratio | 4 | |
| Financial Stability | 2 | |
| Dividend Continuity | 5 | |
| Cashflow Coverage | 4 | |
| Balance Sheet Quality | 3 |
Overall Score: 28/40
🔵 Rating
Cardinal Health, Inc. presents a reliable investment with its robust dividend continuity and moderate growth. While there are challenges in financial stability due to negative equity figures, the strong cash flow positions bolster its dividend reliability. Recommended as a solid hold for investors seeking consistent dividend income with an eye on future growth opportunities through strategic reinvestments. Caution should be exercised with respect to leveraged financials.
Smart Data Insight
Master the Perfect Entry & Exit for this Stock
Don't leave your profits to chance. Historically, this stock follows specific seasonal patterns that institutional traders use to maximize returns.
- ✅ Identify the "Golden Buying Window"
- ✅ Avoid high-risk correction cycles
- ✅ Backtested data from the last 20+ years