February 03, 2026 a 03:31 am

CAH: Dividend Analysis - Cardinal Health, Inc.
Cardinal Health, Inc. (CAH) presents a fascinating prospect for dividend investors with its longevity in dividend history and recent stability in payouts. Despite a rather modest dividend yield of approximately 0.99%, its commitment to sustaining and gradually increasing dividends over the last 41 years reflects financial resilience. The lack of dividend cuts or suspensions further highlights the company's robust ability to generate shareholder returns.
📊 Overview
The following table provides an overview of Cardinal Health's key dividend metrics. The company operates within the sector and showcases a disciplined approach to dividend management.
| Metric | Value |
|---|---|
| Sector | Healthcare |
| Dividend Yield | 0.99% |
| Current Dividend per Share | 2.05 USD |
| Dividend History | 41 years |
| Last Cut/Suspension | None |
📉 Dividend History
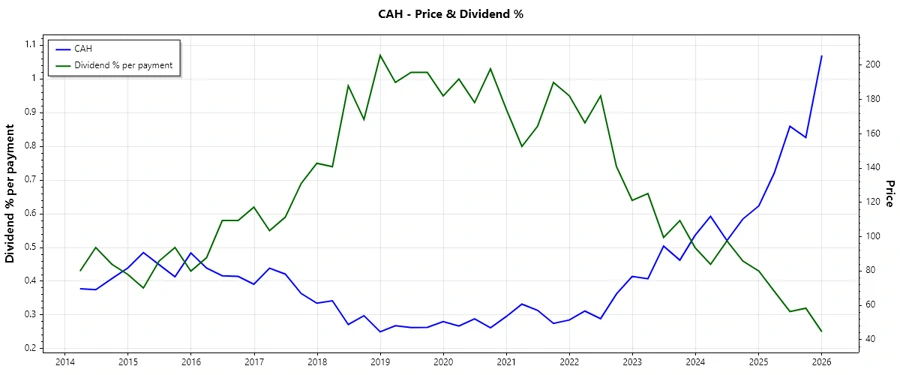
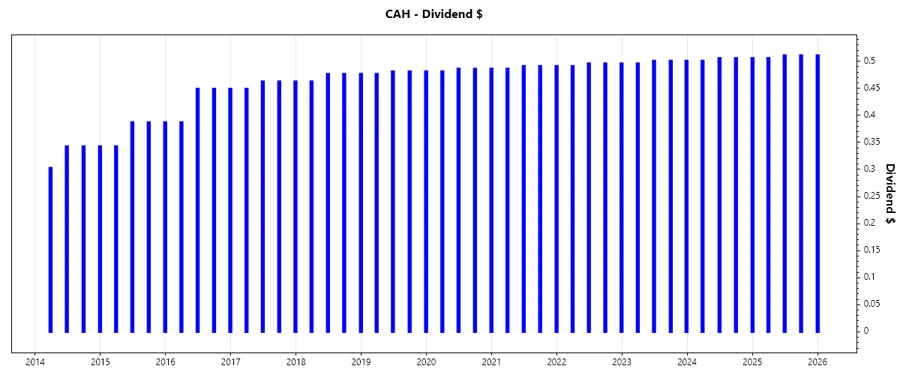
Cardinal Health's dividend history over the past decades underscores its commitment to shareholder returns, making it a reliable choice for income-focused portfolios. A consistent dividend payout strengthens investor confidence and indicates financial health.
| Year | Dividend per Share (USD) |
|---|---|
| 2026 | 0.5107 |
| 2025 | 2.0326 |
| 2024 | 1.5118 |
| 2023 | 1.9975 |
| 2022 | 1.9779 |
📈 Dividend Growth
Assessing the growth of dividends gives investors insight into the company's financial strategy and potential for sustainable income. The growth over the past three and five years is indicative of the company’s ability to enhance shareholder value continually.
| Time | Growth |
|---|---|
| 3 years | 0.91% |
| 5 years | 0.95% |
The average dividend growth is 0.95% over 5 years. This shows moderate but steady dividend growth.
⚠️ Payout Ratio
Payout ratios are crucial indicators of a company’s ability to sustain its dividend payouts. A balanced EPS and FCF payout ratio indicates that the company is not overburdening its finances to distribute dividends.
| Key Figure | Ratio |
|---|---|
| EPS-based | 30.59% |
| Free cash flow-based | 10.94% |
A payout ratio of 30.59% based on EPS and 10.94% based on FCF reflects a comfortable margin for Cardinal Health to maintain and possibly increase its dividends without compromising financial stability.
✅ Cashflow & Capital Efficiency
Understanding a company's cash flow and capital efficiency is crucial in assessing its operational performance and ability to meet financial obligations while reinvesting in growth.
| Metric | 2025 | 2024 | 2023 |
|---|---|---|---|
| Free Cash Flow Yield | 4.57% | 13.57% | 9.57% |
| Earnings Yield | 3.86% | 3.56% | 1.34% |
| CAPEX to Operating Cash Flow | 11.26% | 13.58% | 16.91% |
| Stock-based Compensation to Revenue | 0.13% | 0.05% | 0.05% |
| Free Cash Flow / Operating Cash Flow Ratio | 77.18% | 86.42% | 83.08% |
Cardinal Health maintains robust cash flow stability, enabling it to efficiently meet capital expenditures and shareholder demands.
💡 Balance Sheet & Leverage Analysis
A solid balance sheet provides insight into a company's leverage and financial health. It reflects Cardinal Health's capability to refinance debt and manage financial obligations.
| Metric | 2025 | 2024 | 2023 |
|---|---|---|---|
| Debt-to-Equity | -3.36 | -1.75 | -1.75 |
| Debt-to-Assets | 17.59% | 12.43% | 11.94% |
| Debt-to-Capital | 1.42 | 2.34 | 2.33 |
| Net Debt to EBITDA | 1.76 | 0.24 | 0.76 |
| Current Ratio | 0.94 | 0.98 | 1.00 |
| Quick Ratio | 0.50 | 0.56 | 0.52 |
Despite negative equity positions, Cardinal Health demonstrates adequate liquidity through its current and quick ratios, suggesting manageable financial leverage and liquidity.
🌟 Fundamental Strength & Profitability
Cardinal Health’s profitability metrics are essential in understanding operational efficiency and the company’s adaptability to market conditions.
| Metric | 2025 | 2024 | 2023 |
|---|---|---|---|
| Return on Equity | -56.13% | -26.52% | -11.16% |
| Return on Assets | 2.94% | 1.89% | 0.76% |
| Net Margin | 0.70% | 0.38% | 0.16% |
| EBIT Margin | 1.04% | 0.55% | 0.36% |
| EBITDA Margin | 1.40% | 0.87% | 0.70% |
| Gross Margin | 3.67% | 3.27% | 3.36% |
| R&D to Revenue | 0% | 0% | 0% |
Despite challenges in returns on equity due to its capital structure, Cardinal Health's operating and EBITDA margins suggest a potential for improvement.
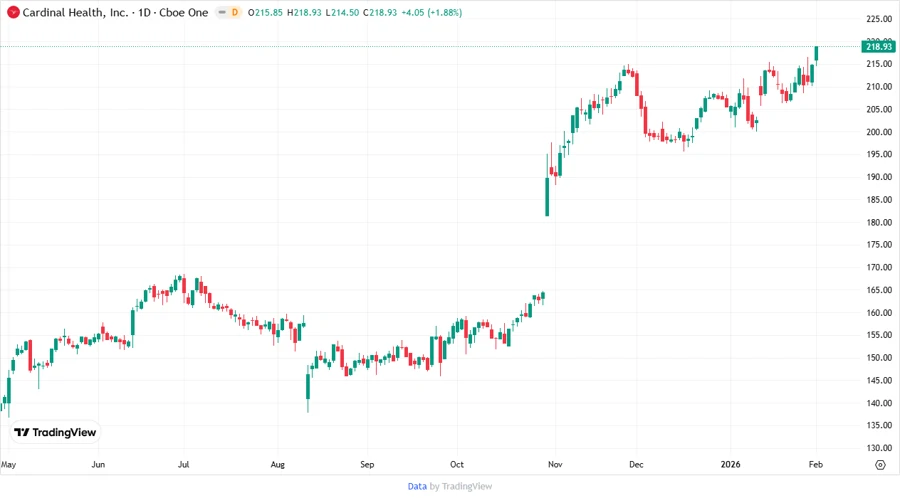
📈 Price Development
🔍 Dividend Scoring System
| Criteria | Score | Score Bar |
|---|---|---|
| Dividend Yield | 2 | |
| Dividend Stability | 4 | |
| Dividend Growth | 3 | |
| Payout Ratio | 4 | |
| Financial Stability | 3 | |
| Dividend Continuity | 5 | |
| Cashflow Coverage | 4 | |
| Balance Sheet Quality | 3 |
Total Score: 28/40
🗣️ Rating
Cardinal Health is a stable company with a long dividend history and a moderate yield. Its financial stability and commitment to dividends make it a suitable choice for conservative dividend investors. However, potential investors should consider the overall financial leverage and fundamental profitability before making investment decisions.