January 31, 2026 a 12:46 pm

CAH: Dividend Analysis - Cardinal Health, Inc.
Cardinal Health, Inc. (CAH) has established a substantial history of dividend payments, underpinning its investor appeal in the healthcare sector. The company remains committed to its dividend payout track record, although recent years have shown minimal growth. As economic conditions fluctuate, CAH's investor decision-making will hinge on its ability to maintain or improve dividend growth, especially under cost containment pressures.
Overview 📊
Cardinal Health, Inc. occupies a significant position in the healthcare sector with a notable market cap. It is noteworthy for its extended dividend history and a modest yield given its long-term track record.
| Attribute | Details |
|---|---|
| Sector | Healthcare |
| Dividend Yield | 0.99% |
| Current Dividend per Share | 2.05 USD |
| Dividend History | 41 years |
| Last Cut or Suspension | None |
Dividend History 🗣️
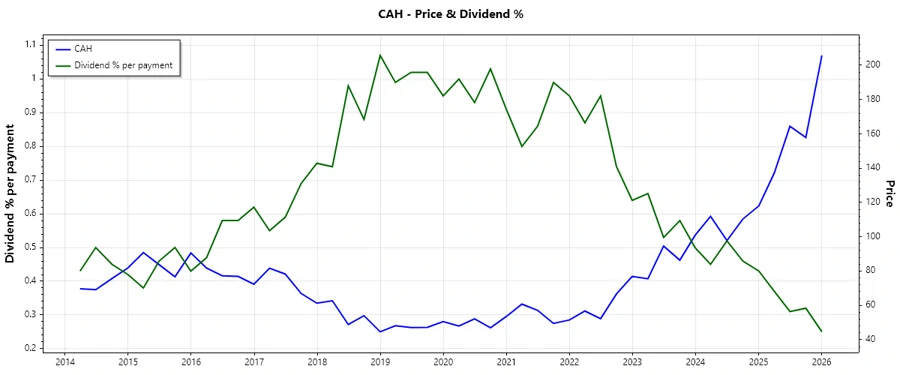
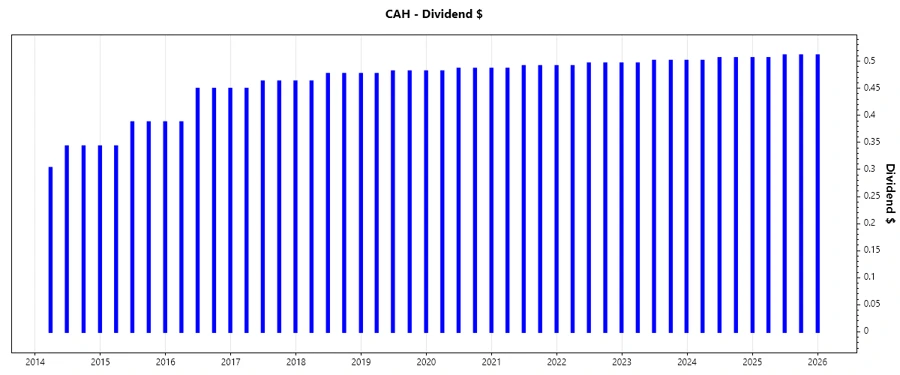
The dividend history of CAH highlights a long-standing commitment to returning value to shareholders. This provides a measure of stability, although recent annual increases are minimal. Analyzing historical dividends allows predicting future trends and understanding stability in past payout schedules.
| Year | Dividend per Share (USD) |
|---|---|
| 2026 | 0.5107 |
| 2025 | 2.0326 |
| 2024 | 1.5118 |
| 2023 | 1.9975 |
| 2022 | 1.9779 |
Dividend Growth 📈
The dividend growth metrics for CAH indicate negligible expansion over the last few years, pointing to a strategy of maintaining consistent payouts rather than aggressive increases. These figures become crucial when considered alongside CAPM and other market-based models that value future cash flow expectations.
| Time | Growth |
|---|---|
| 3 years | 0.91% |
| 5 years | 0.95% |
The average dividend growth is 0.95% over 5 years. This shows moderate but steady dividend growth.
Payout Ratio ✅
Analyzing the payout ratio is essential to gauge dividend sustainability, reflecting the proportion of earnings paid as dividends. Lower ratios suggest room for future growth, whereas high ratios can denote exhaustive earnings distributions.
| Key Figure | Ratio |
|---|---|
| EPS-based | 30.59% |
| Free cash flow-based | 10.94% |
The EPS payout ratio of 30.59% suggests a prudent management approach, while the 10.94% FCF payout ratio implies robust cash backing for dividends, minimizing the risk of unsustainable payouts.
Cashflow & Capital Efficiency 🔍
Evaluating cash flow metrics informs on Cardinal Health's ability to generate sufficient cash for capital investments and shareholder distributions, a crucial metric in capital allocation efficiency.
| Year | 2023 | 2024 | 2025 |
|---|---|---|---|
| Free Cash Flow Yield | 9.57% | 13.57% | 4.57% |
| Earnings Yield | 1.34% | 3.56% | 3.86% |
| CAPEX to Operating Cash Flow | 16.91% | 13.58% | 22.82% |
| Stock-based Compensation to Revenue | 0.05% | 0.05% | 0.11% |
| Free Cash Flow / Operating Cash Flow Ratio | 77.18% | 86.42% | 77.18% |
The cash flows and capital efficiency metrics highlight CAH's solid cash generation ability, crucial for ongoing capital investments and sustaining shareholder returns.
Balance Sheet & Leverage Analysis 🔍
The financial leverage ratios and liquidity metrics provide insights into Cardinal Health's ability to meet its short-term obligations and manage its capital structure effectively.
| Year | 2023 | 2024 | 2025 |
|---|---|---|---|
| Debt-to-Equity | -1.75 | -1.74 | -3.36 |
| Debt-to-Assets | 11.94% | 12.43% | 17.59% |
| Debt-to-Capital | 233.36% | 234.10% | 142.37% |
| Net Debt to EBITDA | 0.76 | 0.24 | 1.76 |
| Current Ratio | 0.96 | 0.98 | 0.93 |
| Quick Ratio | 0.52 | 0.56 | 0.50 |
| Financial Leverage | -14.65 | -14.04 | -19.10 |
CAH's balance sheet illustrates its complex financial structure, reflecting significant debt, warranting careful monitoring for resilience against leverage-induced risks.
Fundamental Strength & Profitability 📈
Understanding the core profitability ratios and return metrics enables assessment of Cardinal Health's potential to generate sustainable profits over time.
| Year | 2023 | 2024 | 2025 |
|---|---|---|---|
| Return on Equity | -11.16% | -26.52% | -56.13% |
| Return on Assets | 0.76% | 1.89% | 2.94% |
| Margins: Net | 0.16% | 0.38% | 0.70% |
| Margins: EBIT | 0.36% | 0.55% | 1.04% |
| Margins: EBITDA | 0.70% | 0.86% | 1.40% |
| Margins: Gross | 3.36% | 3.27% | 3.67% |
| Research & Development to Revenue | 0% | 0% | 0% |
Even with its stable revenue generation, CAH's profitability indicators reflect challenges in achieving positive income returns, highlighting potential areas for efficiency optimization.
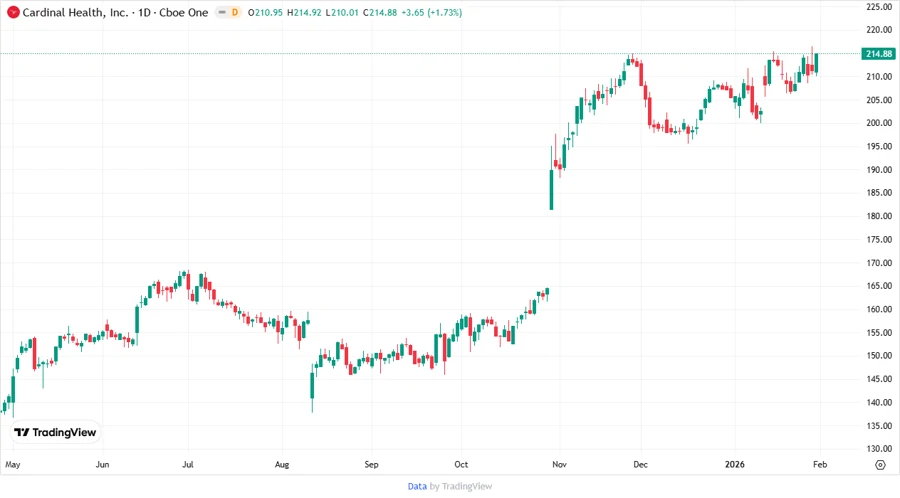
Price Development 📉
Dividend Scoring System ✅
| Criteria | Description | Score |
|---|---|---|
| Dividend Yield | Current yield assessment relative to peers | 3/5 |
| Dividend Stability | Consistency and reliability over years | 5/5 |
| Dividend Growth | Growth rate of dividend payments over time | 2/5 |
| Payout Ratio | Proportion of earnings paid as dividends | 3/5 |
| Financial Stability | Debt and asset management balance | 3/5 |
| Dividend Continuity | Long-term consistency of payments | 5/5 |
| Cashflow Coverage | Ability of cash flows to cover dividends | 4/5 |
| Balance Sheet Quality | Overall financial strength and debt profile | 3/5 |
Overall Score: 28/40
Rating 🏆
Cardinal Health, Inc. exhibits a resilient dividend profile, characterized by longstanding payout history and financial prudence. While growth in distributions remains subdued, its robust cash flow coverage and consistent payout continuity offer compelling reasons for dividend-centric investors to maintain interest. Given the rating, Cardinal Health, Inc., appears to be a stable, albeit modestly growing dividend payer within the healthcare sector.
Smart Data Insight
Master the Perfect Entry & Exit for this Stock
Don't leave your profits to chance. Historically, this stock follows specific seasonal patterns that institutional traders use to maximize returns.
- ✅ Identify the "Golden Buying Window"
- ✅ Avoid high-risk correction cycles
- ✅ Backtested data from the last 20+ years