February 18, 2026 a 04:03 amCAG: Trend and Support & Resistance Analysis - Conagra Brands, Inc.
Conagra Brands, Inc., a leader in North America’s consumer packaged goods food industry, shows dynamic behavior in the stock market. Recently, the stock has demonstrated noteworthy fluctuations, influenced by both company performance and market trends. Investors and analysts are closely watching its movements, focusing on trend patterns and key support and resistance zones. This analysis aims to unravel these patterns, helping stakeholders make informed decisions.
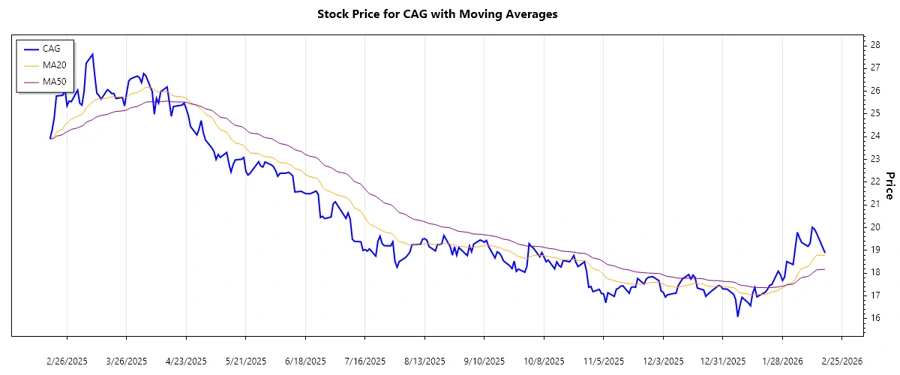
Trend Analysis
Based on the daily closing prices and calculated EMAs, the stock is currently demonstrating an upward trend, as indicated by EMA20 being slightly higher than EMA50. This behavior reflects increased market optimism over the short term.
| Date | Close Price | Trend |
|---|---|---|
| 2026-02-17 | $18.89 | ▲ |
| 2026-02-13 | $19.76 | ▲ |
| 2026-02-12 | $19.94 | ▲ |
| 2026-02-11 | $20.02 | ▲ |
| 2026-02-10 | $19.33 | ▲ |
| 2026-02-09 | $19.18 | ▲ |
| 2026-02-06 | $19.35 | ▲ |
The recent bullish trend suggests potential for continued positive performance, contingent on market conditions and economic factors.
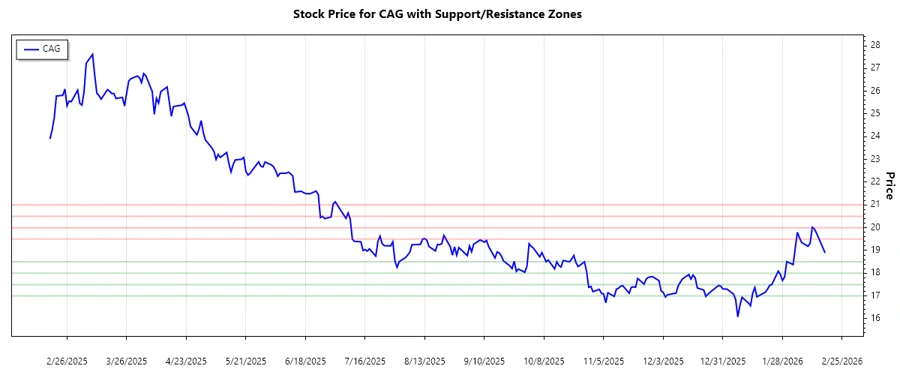
Support and Resistance
The analysis has identified support zones between $18.00-$18.50 and $17.00-$17.50, with resistance zones at $19.50-$20.00 and $20.50-$21.00.
| Zone Type | From | To |
|---|---|---|
| Support 1 | $17.00 | $17.50 |
| Support 2 | $18.00 | $18.50 |
| Resistance 1 | $19.50 | $20.00 |
| Resistance 2 | $20.50 | $21.00 |
Currently, the stock seems to be moving towards the first resistance zone. Close monitoring is advised for breakout opportunities or pullback trends.
Conclusion
The trend analysis indicates a current bullish momentum, bolstering investor confidence. However, key resistance zones present challenges that might lead to temporary setbacks. Sound management of support levels can provide some safety nets for investors. While there are growth opportunities, vigilance is necessary to navigate potential market volatility effectively.