October 26, 2025 a 04:44 pm

CAG: Fibonacci Analysis - Conagra Brands, Inc.
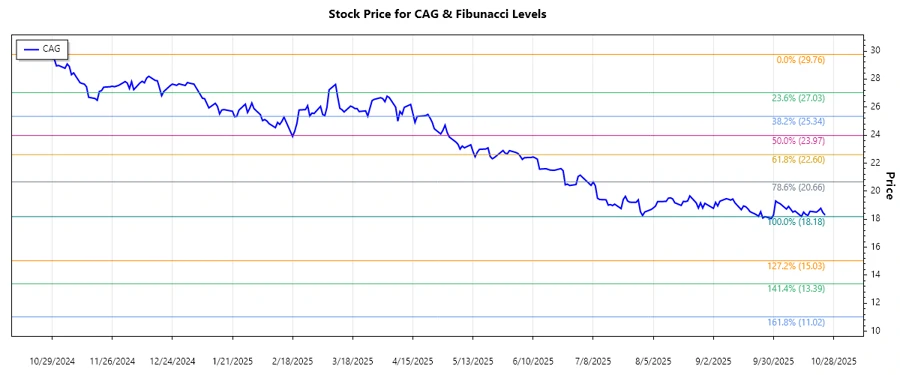
Conagra Brands, Inc. has shown a significant downtrend in the recent months, showing potential investment opportunities for those considering a reversal. Focusing on a diverse array of consumer packaged goods, the company holds a robust portfolio but has faced price corrections. Investors should monitor key technical levels, particularly if the current price falls within a retracement zone, as it may signal crucial support or resistance areas. The stock's performance, influenced by broader market trends, highlights the importance of keeping an eye on economic factors affecting the food industry.
Fibonacci Analysis
| Attribute | Details |
|---|---|
| Start Date | 2024-10-28 |
| End Date | 2025-10-24 |
| High (Price & Date) | $29.76 on 2024-10-28 |
| Low (Price & Date) | $18.18 on 2025-09-26 |
| Fibonacci Level | Price |
|---|---|
| 0.236 | $21.41 |
| 0.382 | $23.03 |
| 0.5 | $23.97 |
| 0.618 | $24.91 |
| 0.786 | $26.31 |
The current price is within the 0.618 retracement zone, indicating potential support at this level.
Technically, this suggests a possible support zone at 0.618, offering a good entry point for bullish investors, while also being cautious of further validation through volume and broader market trends.
Conclusion
The analysis of Conagra Brands, Inc. stock indicates an overall downtrend from its previous highs, reflecting market adjustments. The current Fibonacci retracement analysis provides a technical view on potential support zones, and suggests that the current price level could serve as a critical support point for the stock. For investors, the presence within a notable retracement zone could suggest potential opportunities for gain, particularly if market conditions stabilize. However, the broader food industry's economic influences remain a risk, as consumer behavior and commodity prices could further impact performance. Analysts need to consider both macroeconomic factors and industry specifics when evaluating potential buy signals.
Smart Data Insight
Master the Perfect Entry & Exit for this Stock
Don't leave your profits to chance. Historically, this stock follows specific seasonal patterns that institutional traders use to maximize returns.
- ✅ Identify the "Golden Buying Window"
- ✅ Avoid high-risk correction cycles
- ✅ Backtested data from the last 20+ years