
May 30, 2026 a 07:31 am


CAG: Dividend Analysis - Conagra Brands, Inc.
Conagra Brands, Inc. demonstrates a compelling dividend profile with a substantial yield of nearly 9.76% and an admirable history of 42 years of consistent payouts. Though faced with recent fluctuation challenges, the company's commitment to returning capital to shareholders is evident, positioning it as a potentially lucrative investment for income-focused portfolios.
Overview 📊
Conagra Brands operates in the Packaged Foods sector, maintaining a competitive stance with its significant dividend yield.
| Factor | Details |
|---|---|
| Sector | Packaged Foods |
| Dividend yield | 9.76% |
| Current dividend per share | 1.40 USD |
| Dividend history | 42 years |
| Last cut or suspension | None |
Dividend History 🏛️
The longevity of Conagra's dividend payments reflects financial resilience and shareholder commitment. Its consistent history is crucial for investors seeking predictable income streams.
| Year | Dividend per Share (USD) |
|---|---|
| 2026 | 0.70 |
| 2025 | 1.40 |
| 2024 | 1.40 |
| 2023 | 1.36 |
| 2022 | 1.2850 |
Dividend Growth 📈
A focus on the dividend growth signifies a commitment to enhancing shareholder value, with moderate growth potential pivoting on financial health.
| Time | Growth |
|---|---|
| 3 years | 2.90% |
| 5 years | 8.94% |
The average dividend growth is 8.94% over 5 years. This shows moderate but steady dividend growth.
Payout Ratio 📉
Payout ratios highlight sustainability of dividends vis-à-vis earnings and cash flow, essential for gauging future payout potential.
| Key figure | Ratio |
|---|---|
| EPS-based | -1547.44% |
| Free cash flow-based | 79.50% |
Negative EPS-based payout ratio suggests an unsustainable dividend based strictly on earnings, much unlike the modestly high FCF-based ratio that indicates potential resilience via cash flow.
Cashflow & Capital Efficiency 💵
Insight into cash flow and capital efficiency reveals vital corporate health indicators—liquefaction paths for maintaining dividend integrity.
| Year | 2025 | 2024 | 2023 |
|---|---|---|---|
| Free Cash Flow Yield | 12.16% | 11.23% | 3.80% |
| Earnings Yield | 10.76% | 2.40% | 4.10% |
| CAPEX to Operating Cash Flow | 32.17% | 19.25% | 36.39% |
| Stock-based Compensation to Revenue | 0.49% | 0.26% | 0.65% |
| Free Cash Flow / Operating Cash Flow Ratio | 76.99% | 80.75% | 63.61% |
The data reflects efficient capital deployment methods and a commendable coverage of cash flows, translating to reliable dividend coverage and strategic capital enhancements.
Balance Sheet & Leverage Analysis 📊
Analyzing balance sheet metrics underlines liquidity and solvency, pivotal for assurance of dividend sustainment and leverage management.
| Year | 2025 | 2024 | 2023 |
|---|---|---|---|
| Debt-to-Equity | 0.90 | 1.02 | 1.08 |
| Debt-to-Assets | 0.39 | 0.41 | 0.43 |
| Debt-to-Capital | 0.47 | 0.51 | 0.52 |
| Net Debt to EBITDA | 4.07 | 5.90 | 5.53 |
| Current Ratio | 0.71 | 0.97 | 0.76 |
| Quick Ratio | 0.24 | 0.36 | 0.26 |
High leverage and moderate current and quick ratios necessitate caution, yet reflect a strategic management approach to sustain operations amidst high debt.
Fundamental Strength & Profitability 💪
Home to profitability and operational margins, these fundamentals guide strategic dividends augmentation, aligning with shareholder interest.
| Year | 2025 | 2024 | 2023 |
|---|---|---|---|
| Return on Equity | 12.90% | 4.11% | 7.82% |
| Return on Assets | 5.50% | 1.66% | 3.10% |
| Net Margin | 9.92% | 2.88% | 5.57% |
| EBIT Margin | 13.57% | 8.68% | 10.71% |
| EBITDA Margin | 16.93% | 12.01% | 13.73% |
| Gross Margin | 25.86% | 27.66% | 26.59% |
| R&D to Revenue | 0.52% | 0.51% | 0.47% |
Reflects solid profitability due to efficient operations yet highlights need for improved asset utilization for heightened shareholder returns.
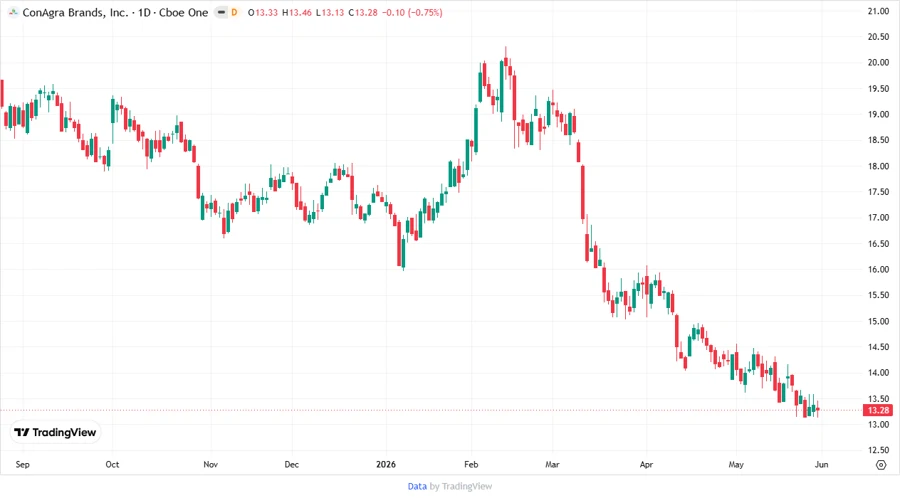
Price Development 📈
Dividend Scoring System 🔍
| Category | Score (out of 5) | Indicator |
|---|---|---|
| Dividend Yield | 5 | |
| Dividend Stability | 4 | |
| Dividend Growth | 3 | |
| Payout Ratio | 2 | |
| Financial Stability | 3 | |
| Dividend Continuity | 4 | |
| Cashflow Coverage | 3 | |
| Balance Sheet Quality | 3 |
Total: 27/40
Rating 🗣️
Conagra Brands' dividend is a double-edged sword, with noteworthy returns but concerns over sustainability. Suitable for a diversified income-seeking strategy, the stock calls for a balanced view on risk versus reward.
Smart Data Insight
Master the Perfect Entry & Exit for this Stock
Don't leave your profits to chance. Historically, this stock follows specific seasonal patterns that institutional traders use to maximize returns.
- ✅ Identify the "Golden Buying Window"
- ✅ Avoid high-risk correction cycles
- ✅ Backtested data from the last 20+ years