September 22, 2025 a 03:32 am
CAG: Dividend Analysis - Conagra Brands, Inc.
Conagra Brands, Inc. stands as a stalwart in the consumer packaged goods industry with a commendable dividend history. With a robust 7.56% dividend yield and a consistent record of payments over 41 years, this company presents promising stability and dividend attraction for income-focused investors.
📊 Overview
Conagra Brands, Inc. operates within the consumer staples sector, providing consistent dividend returns to its investors. The company's commitment is reflected through its dividend yield of 7.56% and a current dividend per share of $1.40, augmented by an impressive dividend payment continuity over 41 years.
| Criteria | Details |
|---|---|
| Sector | Consumer Staples |
| Dividend Yield | 7.56 % |
| Current dividend per share | $1.40 |
| Dividend history | 41 years |
| Last cut or suspension | None |
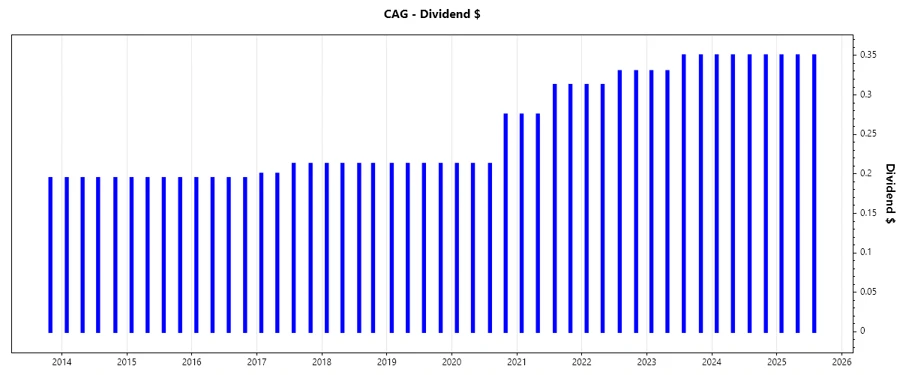
📈 Dividend History
Dividend history is vital as it illustrates a company's financial health, operational efficiency, and management's commitment to returning value to shareholders. Conagra's uninterrupted dividend payments over four decades accentuate its strong performance foundation.
| Year | Dividend per Share (USD) |
|---|---|
| 2025 | $1.05 |
| 2024 | $1.40 |
| 2023 | $1.36 |
| 2022 | $1.285 |
| 2021 | $1.175 |
📈 Dividend Growth
Analyzing the company's dividend growth provides insights into future earnings potential and financial stability. Conagra's willingness to increase its dividends, as indicated by the growth rates, suggests confidence in its operational performance and market position.
| Time | Growth |
|---|---|
| 3 years | 6.01 % |
| 5 years | 10.49 % |
The average dividend growth is 10.49% over 5 years. This shows moderate but steady dividend growth.
📉 Payout Ratio
The payout ratio is a crucial indicator of dividend sustainability. It measures how much of the company's income is returned to shareholders as dividends compared to what is retained as earnings or free cash flow.
| Key figure | Ratio |
|---|---|
| EPS-based | 58.06 % |
| Free cash flow-based | 51.37 % |
With a 58.06% EPS payout ratio and a 51.37% free cash flow payout ratio, Conagra offers a balanced return while retaining sufficient profits for growth and operational needs. This reflects prudent management of capital allocations.
💰 Cashflow & Capital Efficiency
Efficient cashflow management and capital allocation are paramount for sustaining dividends. Conagra's metrics provide a lens into its capability to convert revenues into operational profits and subsequent shareholder returns.
| Year | 2023 | 2024 | 2025 |
|---|---|---|---|
| Free Cash Flow Yield | 3.80 % | 11.23 % | 12.16 % |
| Earnings Yield | 4.10 % | 2.40 % | 10.76 % |
| CAPEX to Operating Cash Flow | 36.39 % | 19.25 % | 23.01 % |
| Stock-based Compensation to Revenue | 0.65 % | 0.26 % | 0.36 % |
| Free Cash Flow / Operating Cash Flow Ratio | 63.61 % | 80.75 % | 76.99 % |
Conagra demonstrates solid cash flow generation with commendable earnings and free cash flow yields, indicative of effective liquidity and resource management.
💼 Balance Sheet & Leverage Analysis
A thorough examination of financial leverage and balance sheet strength is crucial to assess risk and sustainability. Conagra’s leverage ratios underscore its approach towards debt management and financial prudency.
| Year | 2023 | 2024 | 2025 |
|---|---|---|---|
| Debt-to-Equity | 1.08 | 1.02 | 0.93 |
| Debt-to-Assets | 42.71 % | 41.29 % | 39.70 % |
| Debt-to-Capital | 51.88 % | 50.51 % | 48.20 % |
| Net Debt to EBITDA | 6.34 | 5.91 | 4.20 |
| Current Ratio | 0.76 | 0.97 | 0.71 |
| Quick Ratio | 0.26 | 0.33 | 0.24 |
| Financial Leverage | 2.52 | 2.47 | 2.34 |
Conagra's debt metrics are reflective of a managed and methodical approach to leverage, enhancing financial stability while retaining operational flexibility.
📈 Fundamental Strength & Profitability
Understanding profitability metrics is central to evaluating the efficiency and success of company operations. Conagra's robust return metrics attest to its strong operational framework and strategic foresight.
| Year | 2023 | 2024 | 2025 |
|---|---|---|---|
| Return on Equity | 7.82 % | 4.11 % | 12.90 % |
| Return on Assets | 3.10 % | 1.66 % | 5.51 % |
| Margins: Net | 5.57 % | 2.88 % | 9.92 % |
| EBIT | 8.96 % | 8.65 % | 13.54 % |
| EBITDA | 11.97 % | 11.98 % | 16.90 % |
| Gross | 26.74 % | 27.80 % | 26.86 % |
Conagra's profitability remains commendably resilient, indicating operational intelligence and the ability to sustain competitiveness and cash flow robustness.
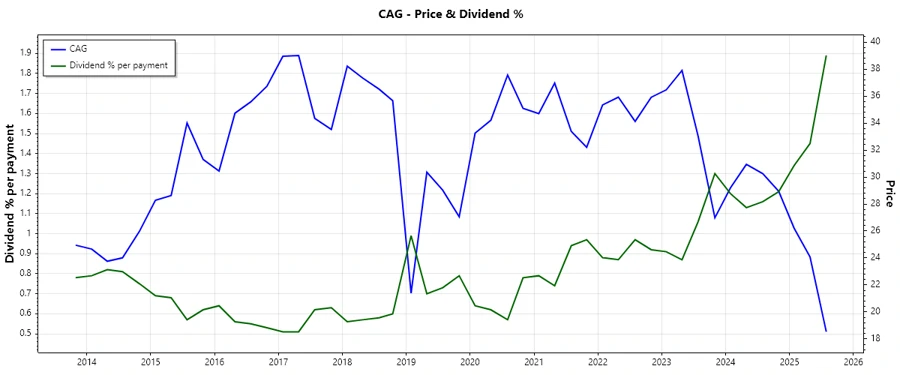
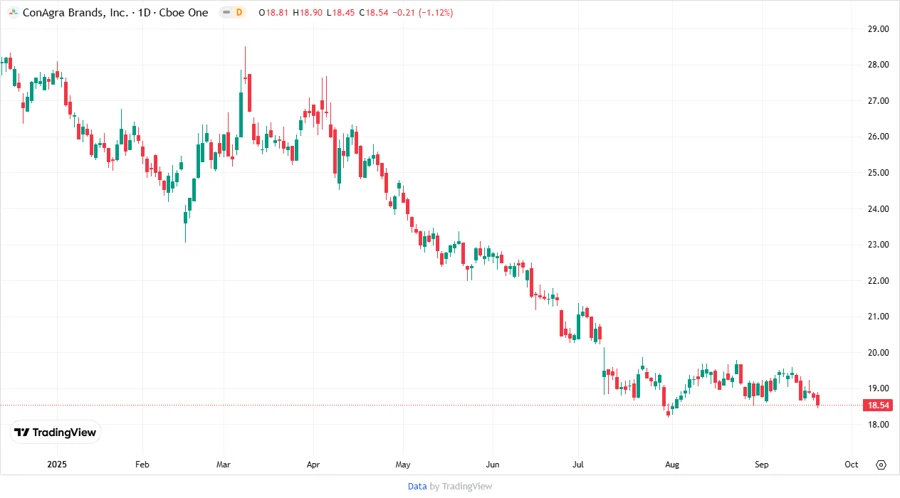
📈 Price Development
🔍 Dividend Scoring System
| Category | Evaluation | Score |
|---|---|---|
| Dividend yield | High | |
| Dividend Stability | Excellent | |
| Dividend Growth | Moderate | |
| Payout ratio | Balanced | |
| Financial Stability | Solid | |
| Dividend Continuity | Outstanding | |
| Cashflow Coverage | Adequate | |
| Balance Sheet Quality | Good |
Total Score: 37/40
✅ Rating
Conagra Brands, Inc. exhibits notable strength in maintaining a high dividend yield paired with solid financial and operational metrics. The sustained growth and stability in dividends propose a lucrative opportunity for investors seeking long-term returns and portfolio stability. The firm's commitment to shareholder value is evident, making it a viable consideration for dividend-focused portfolios.
Smart Data Insight
Master the Perfect Entry & Exit for this Stock
Don't leave your profits to chance. Historically, this stock follows specific seasonal patterns that institutional traders use to maximize returns.
- ✅ Identify the "Golden Buying Window"
- ✅ Avoid high-risk correction cycles
- ✅ Backtested data from the last 20+ years