April 13, 2025 a 07:31 am


CAG: Dividend Analysis - Conagra Brands, Inc.
Conagra Brands, Inc. has shown a resilient dividend history with a solid dividend yield, reflecting its stable financial footing in the consumer packaged goods sector. The company has shown consistent payout practices, although the high EPS payout ratio indicates potential sustainability concerns.
Overview 📊
As an integral player in the consumer packaged goods sector, Conagra Brands, Inc. provides a robust dividend yield of 5.39%, indicating the company's commitment to returning value to shareholders. Despite a high payout ratio, they have managed to maintain a stable dividend history for over four decades, showing resilience and a customer-centric approach.
| Parameter | Detail |
|---|---|
| Sector | Consumer Packaged Goods |
| Dividend yield | 5.39% |
| Current dividend per share | 1.38 USD |
| Dividend history | 41 years |
| Last cut or suspension | None |
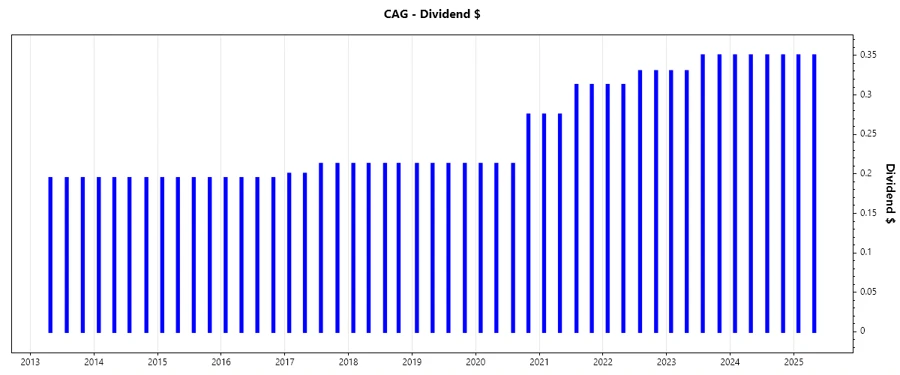
Dividend History 📜
Conagra Brands has demonstrated commitment to its dividend policy by expanding its payments consistently. This history is pivotal as it builds investor confidence and reflects the company's long-term financial health.
| Year | Dividend per Share (USD) |
|---|---|
| 2025 | 0.70 |
| 2024 | 1.40 |
| 2023 | 1.36 |
| 2022 | 1.285 |
| 2021 | 1.175 |
Dividend Growth 📈
The growth in dividends over the past 3 and 5 years underscores steady improvement and commitment to returning shareholder value. Investors view growth indicators as signals of financial robustness and future potential.
| Time | Growth |
|---|---|
| 3 years | 6.01% |
| 5 years | 10.49% |
The average dividend growth is 10.49% over 5 years. This shows moderate but steady dividend growth.
Payout Ratio 🗣️
The EPS-based payout ratio, standing at an alarming 200.12%, highlights potential concerns regarding dividend sustainability. However, the free cash flow payout ratio of 45.42% presents a more manageable scenario.
| Key Figure | Ratio |
|---|---|
| EPS-based | 200.12% |
| Free cash flow-based | 45.42% |
The EPS-based ratio suggests potential overextension, whereas the free cash flow ratio indicates sufficient coverage for dividends.
Cashflow & Capital Efficiency 💵
An analysis of cashflow indicators provides insights into liquidity and capital efficiency, revealing strengths in the operational management and capital allocation strategies of Conagra Brands.
| Year | 2024 | 2023 | 2022 |
|---|---|---|---|
| Free Cash Flow Yield | 11.23% | 3.80% | 4.48% |
| Earnings Yield | 2.40% | 4.10% | 5.58% |
| CAPEX to Operating Cash Flow | 20.91% | 36.39% | 39.45% |
| Stock-based Compensation to Revenue | 0.25% | 0.65% | 0.23% |
| Free Cash Flow / Operating Cash Flow Ratio | 80.75% | 63.61% | 60.55% |
The cashflow metrics are indicative of a strong operational performance with effective debt management and investment strategies, ensuring sustainable capital efficiency.
Balance Sheet & Leverage Analysis ⚖️
A comprehensive examination of leverage metrics helps us gauge financial health and the capability of Conagra Brands to meet its debt obligations efficiently.
| Year | 2024 | 2023 | 2022 |
|---|---|---|---|
| Debt-to-Equity | 1.02 | 1.08 | 1.04 |
| Debt-to-Assets | 41.29% | 42.71% | 40.91% |
| Debt-to-Capital | 50.51% | 51.88% | 51.09% |
| Net Debt to EBITDA | 5.90 | 5.53 | 4.70 |
| Current Ratio | 0.97 | 0.76 | 0.86 |
| Quick Ratio | 0.33 | 0.26 | 0.30 |
| Financial Leverage | 2.47 | 2.52 | 2.55 |
These metrics suggest a company adequately leveraging debt to promote growth while maintaining relatively healthy operational liquidity.
Fundamental Strength & Profitability 📈
Examining profitability metrics, such as return on equity and margins, offers insight into the company's effectiveness in generating profits from its equity capital.
| Year | 2024 | 2023 | 2022 |
|---|---|---|---|
| Return on Equity | 4.11% | 7.82% | 10.11% |
| Return on Assets | 1.66% | 3.10% | 3.96% |
| Net Margin | 2.88% | 5.57% | 7.70% |
| EBIT Margin | 8.68% | 10.71% | 13.53% |
| EBITDA Margin | 12.01% | 13.73% | 16.78% |
| Gross Margin | 27.66% | 26.59% | 24.61% |
The fundamental strengths of the company, demonstrated by stable margins and profitability ratios, suggest efficient operations and opportunities for sustained returns.
Price Development 📉
Dividend Scoring System ✅
| Criterion | Score (1-5) | Score Bar |
|---|---|---|
| Dividend Yield | 4 | |
| Dividend Stability | 4 | |
| Dividend Growth | 3 | |
| Payout Ratio | 2 | |
| Financial Stability | 3 | |
| Dividend Continuity | 4 | |
| Cashflow Coverage | 4 | |
| Balance Sheet Quality | 3 |
Total Score: 27/40
Rating 🏆
Conagra Brands, Inc. demonstrates a robust dividend profile with a competitive yield and stability despite high payout ratios. Given the company's financial metrics and historical dividend reliability, a cautiously optimistic outlook is justifiable for dividend-focused investors seeking income stability with potential for moderate growth.