
July 25, 2026 a 04:28 am
CADJPY: Trend and Support & Resistance Analysis
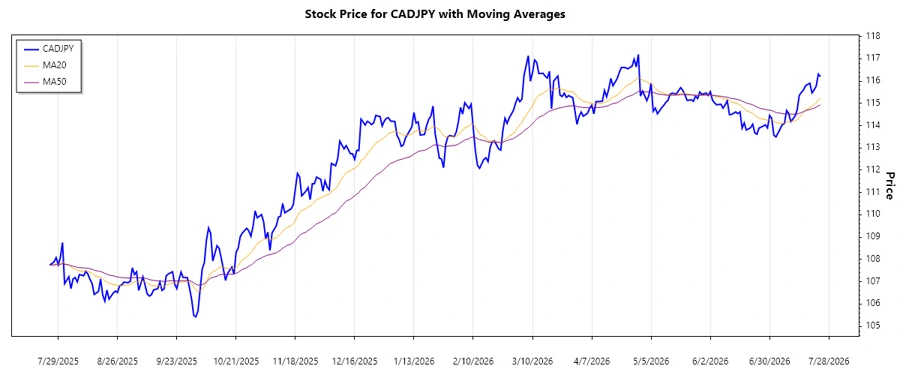
The CADJPY currency pair has shown significant fluctuations over the past months, reflecting broader market volatility and the effects of global economic factors on these currencies. Recent trends in the pair indicate potential areas of market interest based on the calculated support and resistance zones. Our analysis utilizes both EMA indicators and a detailed look into price action to provide insights into the prevailing market movement.
Trend Analysis
Analyzing the historical price data over the past months, the CADJPY pair has demonstrated a rather dynamic range of movements. Calculating the Exponential Moving Averages (EMA), the EMA20 stood higher than the EMA50 for the majority of the recent period, indicating an uptrend. Any recent corrections appear as temporary pullbacks rather than trend reversals. Below is an analysis of the most recent week's data:
| Date | Close Price | Trend |
|---|---|---|
| 2026-07-24 | 116.197 | ▲ Uptrend |
| 2026-07-23 | 116.31 | ▲ Uptrend |
| 2026-07-22 | 115.774 | ▲ Uptrend |
| 2026-07-21 | 115.6 | ▲ Uptrend |
| 2026-07-20 | 115.469 | ▲ Uptrend |
| 2026-07-19 | 115.902 | ▲ Uptrend |
| 2026-07-17 | 115.794 | ▲ Uptrend |
This uptrend indicates sustained bullish sentiment. Traders should watch for potential continuations of this pattern, particularly if other market fundamentals align. The visual representation below further clarifies the trend direction:
Support and Resistance
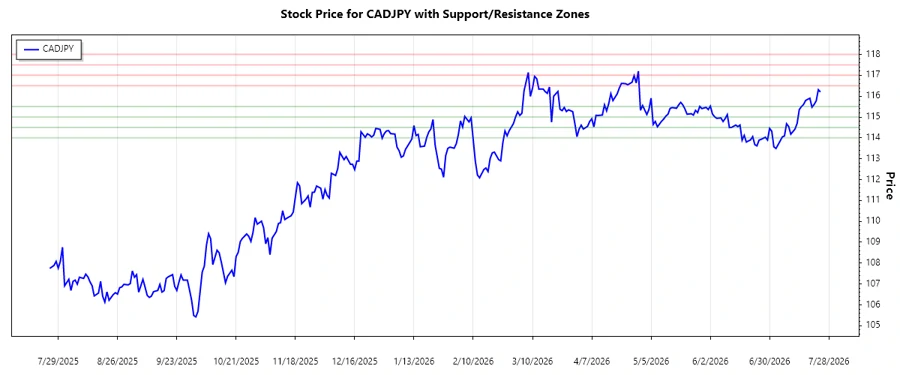
Based on our price analysis, several key support and resistance levels have emerged. These zones may provide clues about potential price reactions:
| Zone Type | Range | |
|---|---|---|
| Support 1 | 115.0 - 115.5 | ▼ Support Zone |
| Support 2 | 114.0 - 114.5 | ▼ Support Zone |
| Resistance 1 | 116.5 - 117.0 | ▲ Resistance Zone |
| Resistance 2 | 117.5 - 118.0 | ▲ Resistance Zone |
Currently, CADJPY seems to be testing the upper resistance zone. Should there be a decisive break above, this could signal further bullishness. Conversely, a bounce below resistance could trigger a rotation back toward support.
Conclusion
The CADJPY currency pair is currently in a bullish trajectory, supported by consistent trends in the moving averages. While there is potential for continued upward momentum, attention should be paid to key resistance zones which may act as barriers. Analysts should remain vigilant about external factors influencing these currencies, particularly any shifts in economic policy from Canada or Japan. Ultimately, monitoring the defined support and resistance zones will be crucial for identifying potential breakout or reversal points.
Smart Data Insight
Master the Perfect Entry & Exit for this Stock
Don't leave your profits to chance. Historically, this stock follows specific seasonal patterns that institutional traders use to maximize returns.
- ✅ Identify the "Golden Buying Window"
- ✅ Avoid high-risk correction cycles
- ✅ Backtested data from the last 20+ years