March 21, 2026 a 04:28 am

CADJPY: Trend and Support & Resistance Analysis
The CADJPY pair has exhibited notable trends over the past months. Recent data suggests stabilization following periods of significant market fluctuations. Traders should be vigilant about market movements, as opportunities and risks are evolving. This report offers detailed insights into the current trend, as well as support and resistance levels critical for future strategy planning.
Trend Analysis
| Date | Closing Price | Trend |
|---|---|---|
| 2026-03-20 | 115.999 | ▲ |
| 2026-03-19 | 114.750 | ▲ |
| 2026-03-18 | 116.436 | ▲ |
| 2026-03-17 | 116.134 | ▲ |
| 2026-03-16 | 116.216 | ▲ |
| 2026-03-15 | 116.343 | ▲ |
| 2026-03-13 | 116.335 | ▲ |
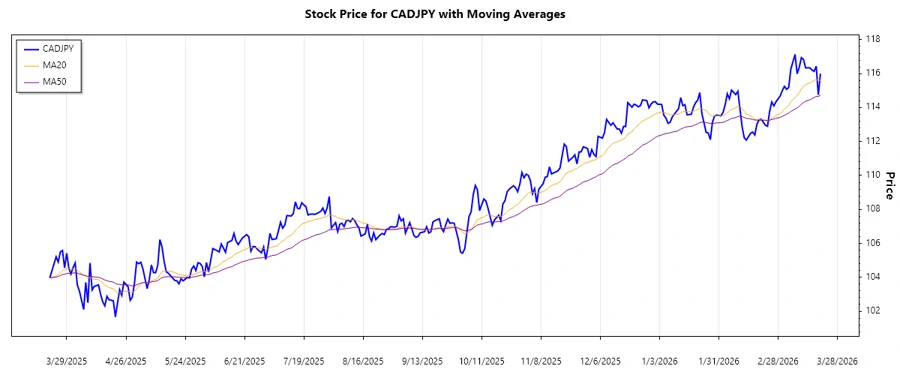
Analysis of the recent CADJPY closing prices suggests an ▲ uptrend, as shown by the higher EMA20 compared to the EMA50. This indicates a bullish sentiment in the market, which can be advantageous for traders favoring long positions. It's critical to keep monitoring these indicators to adjust strategies as needed.
Support and Resistance
| Type | From | To |
|---|---|---|
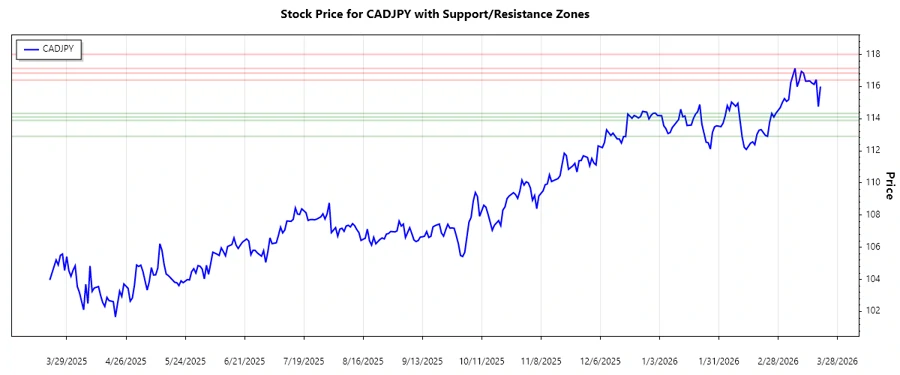
| Support | 114.10 | 114.33 |
| Support | 112.90 | 113.90 |
| Resistance | 116.40 | 116.83 |
| Resistance | 117.13 | 118.00 |
The current CADJPY price is within the higher resistance zone. This suggests testing of resistance levels, and potential breakout possibilities. Analysts should watch for confirmation indicators to gauge potential reversals or continuations.
Conclusion
The CADJPY appears to be in a bullish phase, with indicators favoring potential upward moves. However, significant resistance levels might impede rapid growth unless broken. Traders are advised to monitor global market factors influencing CADJPY, balancing between emerging opportunities and the inherent risks.