December 02, 2025 a 04:28 am

CADJPY: Trend and Support & Resistance Analysis
The CADJPY currency pair has shown dynamic movements over the past months. As of late, the pair is displaying a clear directional bias. By analyzing key indicators such as EMA20 and EMA50, we can discern ongoing trends, determine pivotal support and resistance zones, and comprehend the potential direction moving forward.
Trend Analysis
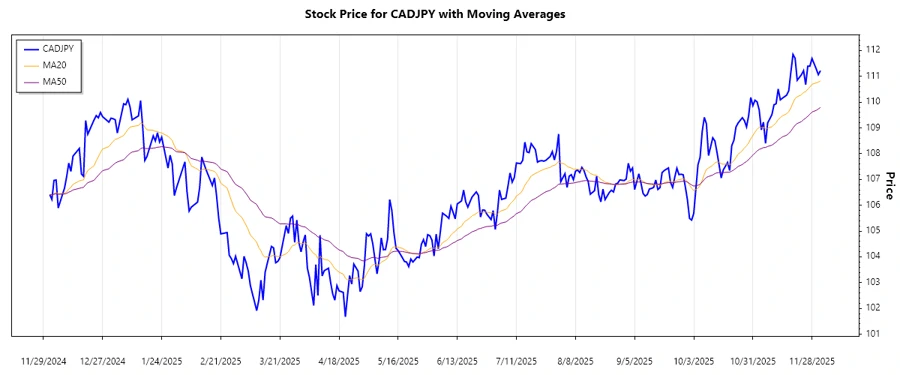
The trend analysis for CADJPY reveals significant insights when applying the EMA20 and EMA50 indicators. Over the last periods, the exponential moving averages indicate a dominantly upward trajectory, with short-term fluctuations.
| Date | Closing Price | Trend |
|---|---|---|
| 02 Dec 2025 | 111.22 | ▲ |
| 01 Dec 2025 | 111.066 | ▲ |
| 30 Nov 2025 | 111.289 | ▲ |
| 28 Nov 2025 | 111.692 | ▲ |
| 27 Nov 2025 | 111.396 | ▲ |
| 26 Nov 2025 | 111.391 | ▲ |
| 25 Nov 2025 | 110.68 | ▲ |
The consistent upward movement in recent days suggests that the market has been experiencing a bullish phase, substantiated by the EMA20 maintaining a position above the EMA50.
Support- and Resistance
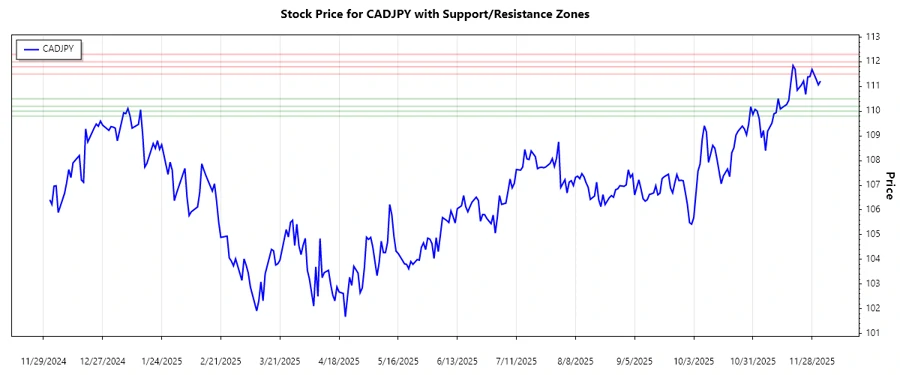
Utilizing the recent closing prices, two primary support and resistance zones have been determined. These zones are pivotal for traders to observe potential reversal or continuation signals within the CADJPY market.
| Zone Type | From | To | Direction |
|---|---|---|---|
| Support Zone 1 | 110.20 | 110.50 | ▼ |
| Support Zone 2 | 109.80 | 110.00 | ▼ |
| Resistance Zone 1 | 111.50 | 111.80 | ▲ |
| Resistance Zone 2 | 112.00 | 112.30 | ▲ |
The current price is nearing the first resistance zone, suggesting potential pressure that traders should closely monitor in the upcoming sessions.
Conclusion
The CADJPY pair emerges as a robust prospect, maintaining an upward trend, as reflected by the EMA indicators. Key resistance levels signal where the market might stall or reverse. However, should these barriers be breached, further upward momentum is likely. Conversely, downside risks remain limited to the identified support zones. Consequently, analysts should remain vigilant, leveraging these insights for precise market entry and exit strategies.