September 20, 2025 a 04:28 am

CADJPY: Trend and Support & Resistance Analysis
The CADJPY currency pair has exhibited moderate fluctuations over the past months, with moments of both strength and weakness reflecting market sentiments. Recent data suggests a potential stabilization in the movement with some lateral shifts. Market participants should be attentive to the emerging trend indicators and the clearly defined support and resistance zones. These areas will be vital in determining potential entry and exit points in trading strategies.
Trend Analysis
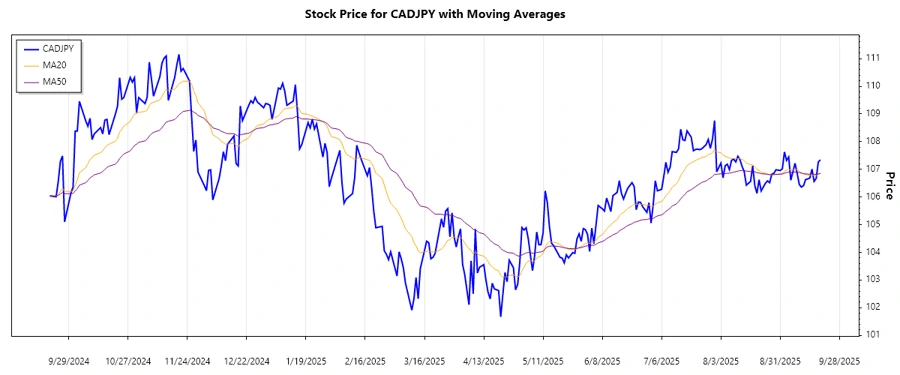
Analyzing the recent movements in CADJPY, the currency is exhibiting signals of a potential sideways trend, as indicated by the calculation of EMA20 and EMA50 which are closely aligned. This suggests uncertain market directions but provides a neutral trading stance.
| Date | Closing Price | Trend |
|---|---|---|
| 2025-09-19 | 107.346 | ⚖️ |
| 2025-09-18 | 107.26781 | ⚖️ |
| 2025-09-17 | 106.672 | ⚖️ |
| 2025-09-16 | 106.564 | ⚖️ |
| 2025-09-15 | 107.007 | ⚖️ |
| 2025-09-14 | 106.69 | ⚖️ |
| 2025-09-13 | 106.653 | ⚖️ |
The sideways trend suggests cautious trading. The absence of a clear directional bias calls for strategic patience and close monitoring of the currency pair.
Support- and Resistance
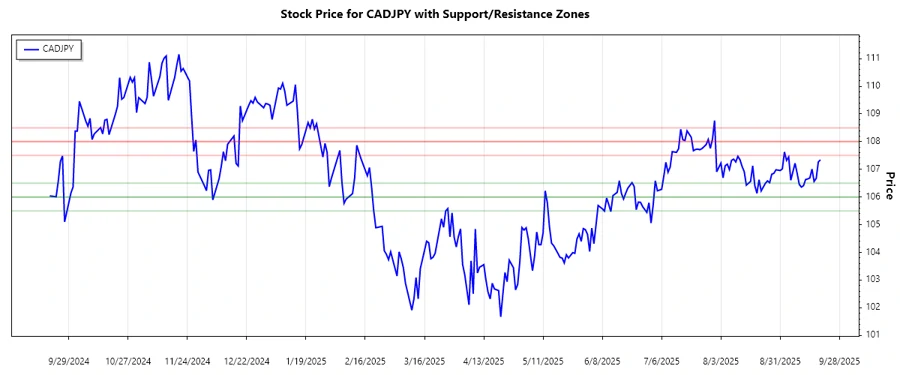
Upon analyzing support and resistance levels, the CADJPY pair has clearly demarcated zones, offering traders possible price reversal points. These levels help in executing precision trades.
| Zone Type | From | To |
|---|---|---|
| Support Zone 1 | 106.0 | 106.5 |
| Support Zone 2 | 105.5 | 106.0 |
| Resistance Zone 1 | 107.5 | 108.0 |
| Resistance Zone 2 | 108.0 | 108.5 |
The current market price is nearing the lower resistance zone, suggesting vigilance for a potential breakout or reversal. Traders can capitalize on these zones for strategic trade placements.
Conclusion
In conclusion, the CADJPY currency pair currently presents a predominantly sideways trend, characterized by uncertain market movements as indicated by nearly converging EMA lines. The identified support and resistance zones offer valuable information for evaluating potential trade entries or exits, with the pair nearing a resistance zone which may signal a forthcoming change in market sentiment. Traders should remain cautiously observant, as the situation may lead to a breakout. While opportunities exist, awareness of potential risks is essential in navigating the unstable market waves during this period.
Smart Data Insight
Master the Perfect Entry & Exit for this Stock
Don't leave your profits to chance. Historically, this stock follows specific seasonal patterns that institutional traders use to maximize returns.
- ✅ Identify the "Golden Buying Window"
- ✅ Avoid high-risk correction cycles
- ✅ Backtested data from the last 20+ years