
July 09, 2025 a 04:28 am
CADJPY: Trend and Support & Resistance Analysis
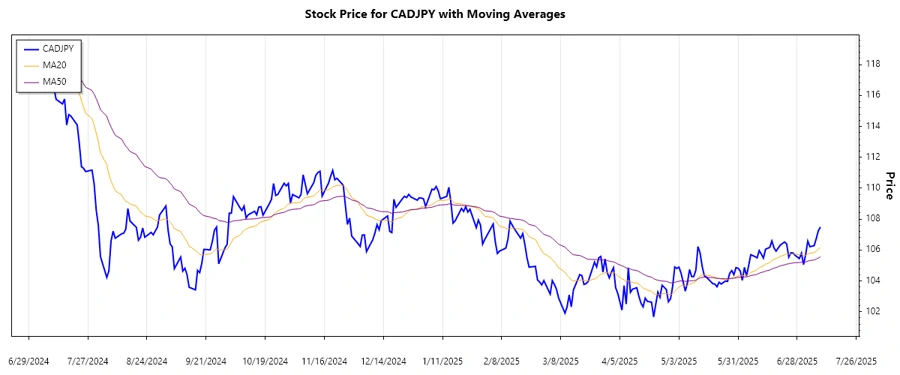
The CADJPY currency pair has exhibited significant volatility in recent months. It appears to be in a transition phase between various market sentiments, which offers potential trading opportunities. The technical analysis indicates a complex movement, with notable fluctuations around key support and resistance zones. Observing the moving averages, traders need to consider potential shifts in trend direction.
Trend Analysis
| Date | Closing Price | Trend |
|---|---|---|
| 2025-07-09 | 107.488 | ▲ Uptrend |
| 2025-07-08 | 107.242 | ▲ Uptrend |
| 2025-07-07 | 106.73 | ⚖️ Sideways Trend |
| 2025-07-06 | 106.277 | ⚖️ Sideways Trend |
| 2025-07-04 | 106.214 | ▼ Downtrend |
| 2025-07-03 | 106.576 | ▼ Downtrend |
| 2025-07-02 | 105.707 | ▼ Downtrend |
The analysis of CADJPY reflects mixed trends, though a gradual upward push is observable in the last seven days, indicating a potential establishment of a new uptrend pattern.
Support and Resistance
| Zone | From | To | |
|---|---|---|---|
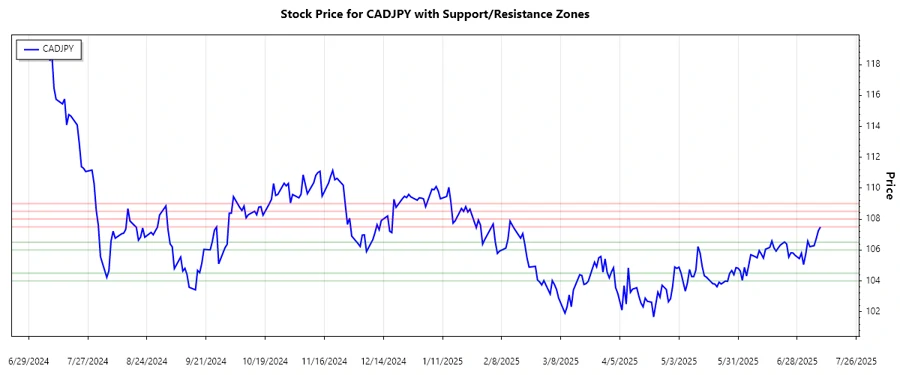
| Support Zone 1 | 104.00 | 104.50 | ▼ |
| Support Zone 2 | 106.00 | 106.50 | ▼ |
| Resistance Zone 1 | 107.50 | 108.00 | ▲ |
| Resistance Zone 2 | 108.50 | 109.00 | ▲ |
Currently, the CADJPY price hovers within the identified support zone, suggesting a price consolidation. This zone presents an opportunity for potential rebounds.
Conclusion
The CADJPY currency pair presents a complex opportunity for analysts. The recent trends suggest potential upward momentum that could be beneficial for traders if market conditions are favorable. The support and resistance zones present important price levels where traders should watch for potential reversals or breakouts. It is essential for traders to acknowledge the inherent risks, focusing on strong technical entries and ongoing market assessment to capitalize on opportunities effectively.
Smart Data Insight
Master the Perfect Entry & Exit for this Stock
Don't leave your profits to chance. Historically, this stock follows specific seasonal patterns that institutional traders use to maximize returns.
- ✅ Identify the "Golden Buying Window"
- ✅ Avoid high-risk correction cycles
- ✅ Backtested data from the last 20+ years