May 27, 2025 a 04:28 am
CADJPY: Trend and Support & Resistance Analysis
CADJPY has experienced significant fluctuations over the past months. The recent market behavior suggests a potential for both bullish and bearish movements, with a critical evaluation of technical indicators. Traders should remain cautious of sudden shifts and consider hedging strategies.
Trend Analysis
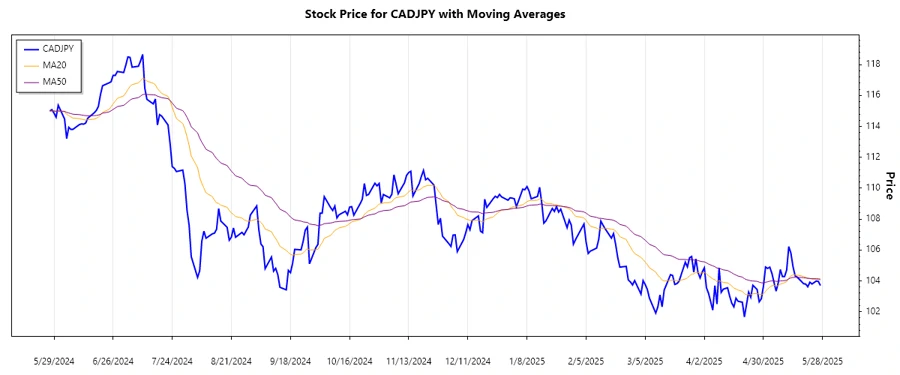
The trend analysis over the past few months reveals a challenging environment for the CADJPY pair. By calculating the EMA20 and EMA50, we found:
| Date | Closing Price | Trend |
|---|---|---|
| 2025-05-27 | 103.699 | ▼ |
| 2025-05-26 | 103.967 | ▼ |
| 2025-05-25 | 103.989 | ▲ |
| 2025-05-23 | 103.797 | ▼ |
| 2025-05-22 | 103.913 | ▲ |
| 2025-05-21 | 103.619 | ▼ |
| 2025-05-20 | 103.796 | ▲ |
The analysis indicates a general bearish trend, as reflected in the EMA calculations. With EMA20 frequently below EMA50, CADJPY faces downward pressure.
Support and Resistance
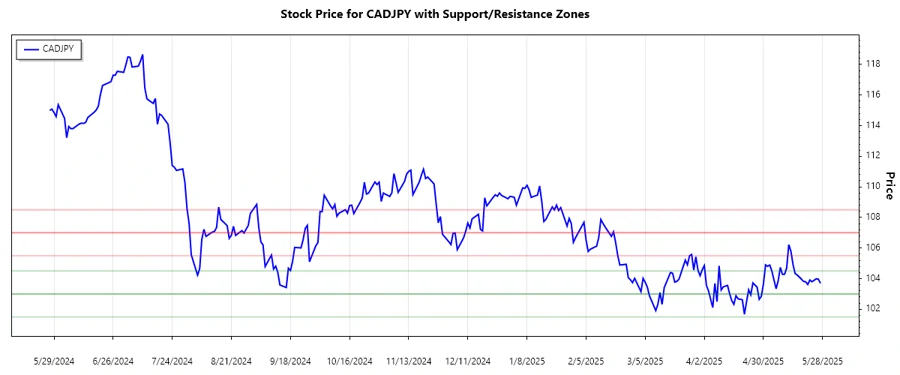
An investigation into the historical price data provides insight into potential support and resistance zones:
| Zone | From | To | Description |
|---|---|---|---|
| Support 1 | 103.00 | 104.50 | Current ▼ |
| Support 2 | 101.50 | 103.00 | Possible ▼ |
| Resistance 1 | 105.50 | 107.00 | Near ▲ |
| Resistance 2 | 107.00 | 108.50 | Far ▲ |
The current price is within the primary support zone, suggesting a potential rebound or further decline. Active monitoring is advised for traders.
Conclusion
The analysis of CADJPY highlights an intricate market structure that demands careful navigation. While opportunities exist for gains, the risks associated with potential volatility should not be underestimated. Analyst interpretations point to a favorable probability of price stabilization with cautious optimism.
Smart Data Insight
Master the Perfect Entry & Exit for this Stock
Don't leave your profits to chance. Historically, this stock follows specific seasonal patterns that institutional traders use to maximize returns.
- ✅ Identify the "Golden Buying Window"
- ✅ Avoid high-risk correction cycles
- ✅ Backtested data from the last 20+ years