January 16, 2026 a 05:08 am
CADJPY: Fibonacci Analysis
The CADJPY pair has shown varied performance over time, reflecting the economic outlooks of Canada and Japan. It is important for traders and analysts to monitor this currency pair, as both oil prices and monetary policy affect its valuation. Recently, the CADJPY has been subject to fluctuations due to global economic changes, making it an interesting candidate for technical analysis.
Fibonacci Analysis
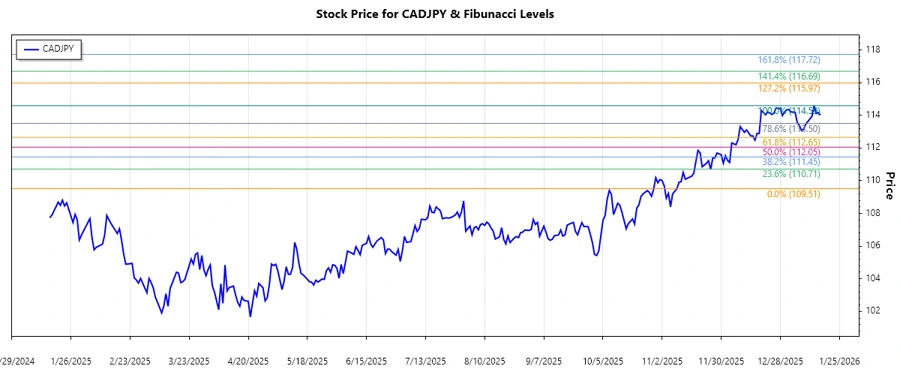
Analyzing the CADJPY pair from September 2025 to January 2026, we observe a dominant upward trend starting from a low in November 2025 to a high in January 2026. This significant rally marks a compelling phase for Fibonacci analysis. The current price level is at 114.009, as of January 16, 2026.
| Trend Details | Info |
|---|---|
| Trend Start Date | 2025-11-10 |
| Trend End Date | 2026-01-16 |
| High Price | 114.587 on 2026-01-13 |
| Low Price | 109.512 on 2025-11-09 |
| Fibonacci Level | Price Level |
|---|---|
| 0.236 | 113.434 |
| 0.382 | 112.642 |
| 0.5 | 112.050 |
| 0.618 | 111.458 |
| 0.786 | 110.603 |
The CADJPY is currently in the 0.236 Fibonacci retracement zone. This suggests a potential support level, indicating a possible rebound or continuation of the upward trend if the support holds.
Conclusion
The CADJPY presented a strong upward trend from November 2025 to January 2026, which appears to be reaching a critical juncture in the short term. The retracement levels suggest potential support around the 0.236 level, offering technical traders a point of interest to monitor for potential buying opportunities. However, traders should remain cautious of market volatility and external economic factors that may influence the pair’s future trajectory. Balancing these considerations is crucial for effective risk management in the evolving landscape of forex trading.