August 16, 2025 a 05:08 am

CADJPY: Fibonacci Analysis
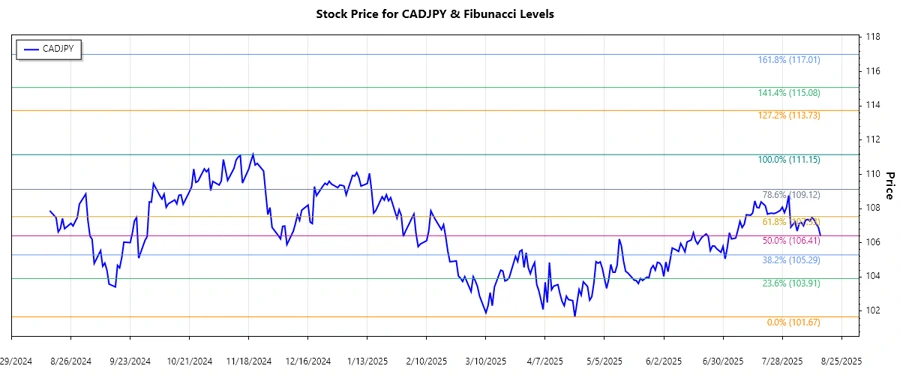
The CADJPY currency pair has presented a consistent upward trend over recent months. This trend is likely influenced by economic factors affecting both the Canadian and Japanese economies. As we conduct a Fibonacci analysis, it’s important to monitor potential retracements that may highlight key levels of support or resistance. Volatility in this pair is normal, reflecting changes in market sentiment and economic data.
Fibonacci Analysis
| Trend Timing | High | Low |
|---|---|---|
| Start: 2024-11-19 End: 2025-08-15 |
Price: 111.151 Date: 2024-11-20 |
Price: 101.67 Date: 2025-04-21 |
| Fibonacci Level | Price Level |
|---|---|
| 0.236 | 103.99 |
| 0.382 | 105.66 |
| 0.5 | 106.71 |
| 0.618 | 107.76 |
| 0.786 | 109.32 |
As of the most recent update, the current price level of 106.428 is located just below the 0.5 retracement level, indicating that the current market price is in a retracement phase from its recent highs. This suggests potential support around this level, making it an attractive area for bulls to watch closely.
Conclusion
The continued movement of CADJPY suggests both opportunities and risks for traders and investors. The recent uptrend offers clues for a potential bullish market, but the retracement levels identified through Fibonacci analysis serve as critical indicators for potential reversal or consolidation zones. It is essential for market participants to stay informed on macroeconomic factors that may impact this currency pair. While the current support level presents a promising entry point, attention should be given to potential signs of a further downturn. Due diligence and active monitoring are advised for positioning.
Smart Data Insight
Master the Perfect Entry & Exit for this Stock
Don't leave your profits to chance. Historically, this stock follows specific seasonal patterns that institutional traders use to maximize returns.
- ✅ Identify the "Golden Buying Window"
- ✅ Avoid high-risk correction cycles
- ✅ Backtested data from the last 20+ years