
July 23, 2026 a 04:28 am
CADCHF: Trend and Support & Resistance Analysis
The CADCHF currency pair has seen varied fluctuations over the past months. Recently, there's a suggestion of a strengthening trend, although fluctuations remain prominent. Traders need to stay alert to the evolving market dynamics. The analysis focuses on identifying whether an upward or downward trend dominates and how current support and resistance zones play a role in anticipating future price movements.
Trend Analysis
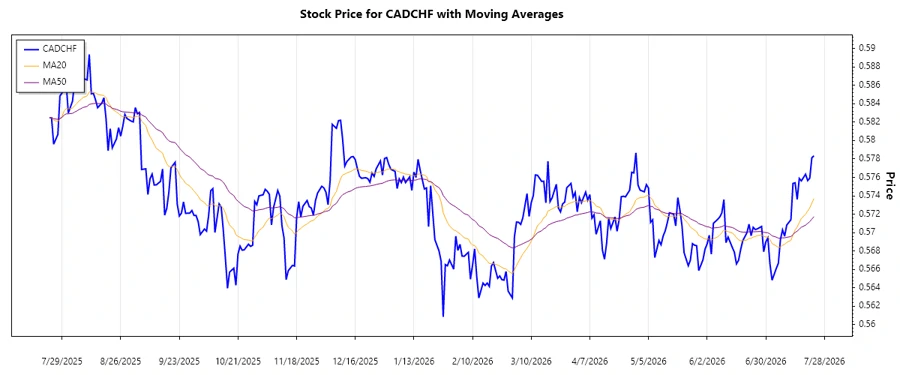
Analyzing the recent price data, the CADCHF seems to fluctuate within a tight range. Calculations show that the EMA20 is closer to the EMA50, indicating a possible shift towards a neutral or sideways trend. The recent price movements suggest short-term consolidation, with potential for a breakout either upwards or downwards based on broader market signals.
| Date | Close Price | Trend |
|---|---|---|
| 2026-07-23 | 0.57834 | ⚖️ Sideways |
| 2026-07-22 | 0.57813 | ▲ Slight Upward |
| 2026-07-21 | 0.57591 | ▼ Downward |
| 2026-07-20 | 0.57565 | ▼ Downward |
| 2026-07-19 | 0.57634 | ▲ Upward |
| 2026-07-17 | 0.57562 | ⚖️ Sideways |
| 2026-07-16 | 0.57588 | ▲ Upward |
The CADCHF's interaction with its moving averages suggests a market that is hesitant to commit to a single direction. This suggests the currency pair is waiting for major economic cues.
Support and Resistance
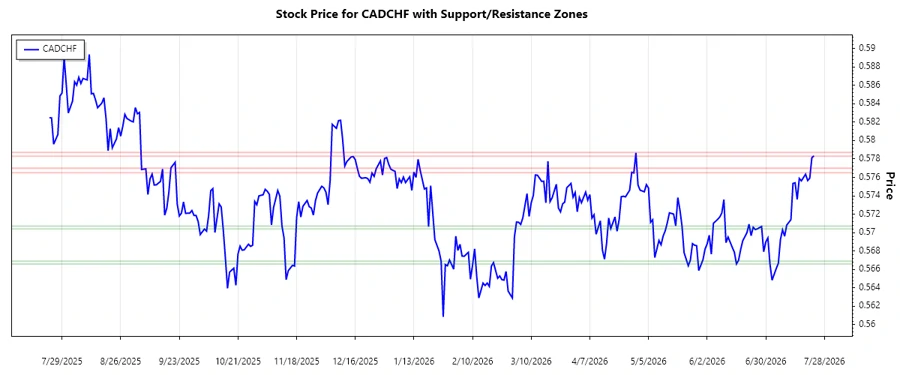
Key zones have been identified where the CADCHF price may potentially face support or resistance. Support levels are observed at prior lows where price has shown buying interest, while resistance levels occur at the peaks where selling pressure has previously mounted.
| Zone Type | Zone Start | Zone End |
|---|---|---|
| Support 1 | 0.56660 | 0.56690 |
| Support 2 | 0.57040 | 0.57070 |
| Resistance 1 | 0.57650 | 0.57700 |
| Resistance 2 | 0.57830 | 0.57870 |
Currently, the CADCHF is trading close to the identified resistance zone, indicating potential for either a breakout if economic conditions support it or a reversal if selling pressure returns.
Conclusion
The analysis of the CADCHF underscores a market navigating through a period of consolidation with hints of directional indecision. There's been historical resistance at higher levels and support at lower levels, suggesting that while short-term opportunities exist, traders should be cautious about long-term positioning. Economic indicators and market sentiment could tip the balance, but currently, the apparatus suggests cautious optimism with a potential for risk aversion. Analysts should keep abreast of global financial developments which may impact the currency's outlook.
Smart Data Insight
Master the Perfect Entry & Exit for this Stock
Don't leave your profits to chance. Historically, this stock follows specific seasonal patterns that institutional traders use to maximize returns.
- ✅ Identify the "Golden Buying Window"
- ✅ Avoid high-risk correction cycles
- ✅ Backtested data from the last 20+ years