
June 05, 2026 a 04:28 am

CADCHF: Trend and Support & Resistance Analysis
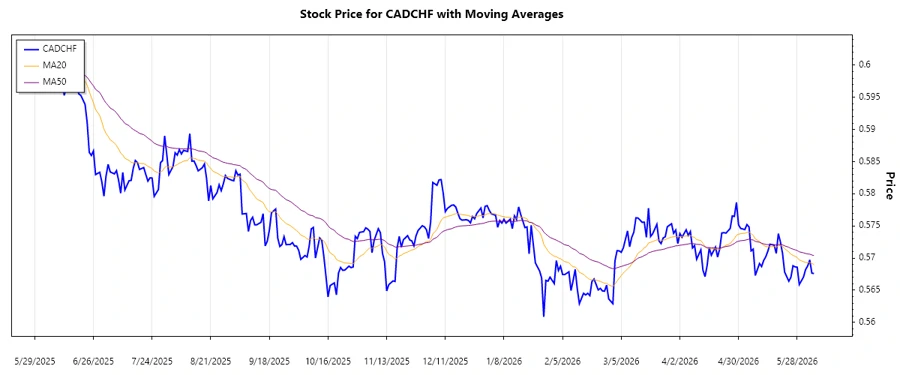
The CADCHF currency pair has displayed significant volatility over recent months. Despite brief periods of upward momentum, the overall trend has been predominantly downward. Investors should be cautious and watch for potential support zones as the market reacts to global economic factors. The current analysis focuses on understanding these movements through technical indicators and provides key support and resistance levels.
Trend Analysis
| Date | Closing Price | Trend |
|---|---|---|
| 2026-06-05 | 0.56759 | ▼ |
| 2026-06-04 | 0.56766 | ▼ |
| 2026-06-03 | 0.56971 | ▼ |
| 2026-06-02 | 0.56877 | ▼ |
| 2026-06-01 | 0.56821 | ▼ |
| 2026-05-31 | 0.56704 | ▼ |
| 2026-05-29 | 0.56588 | ▼ |
The CADCHF pair is primarily in a downward trend, as indicated by the EMA20 falling below the EMA50. This suggests ongoing bearish sentiment among investors.
Support and Resistance
| Zone Type | Price Range |
|---|---|
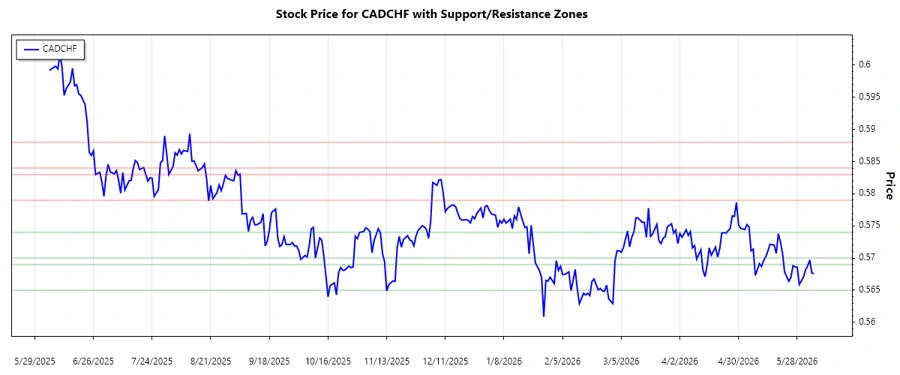
| Support Zone 1 | 0.565 - 0.569 |
| Support Zone 2 | 0.570 - 0.574 |
| Resistance Zone 1 | 0.579 - 0.583 |
| Resistance Zone 2 | 0.584 - 0.588 |
Currently, the CADCHF pair is hovering near the first support zone. A breach below it may lead to further declines.
Conclusion
Overall, the CADCHF displays a bearish trend. Investors should be watchful for breaks below the support levels, which could signal further selling pressure. However, if the currency pair rebounds from current support levels, it might present a buying opportunity. As always, economic and geopolitical factors should be considered for comprehensive analysis.
Smart Data Insight
Master the Perfect Entry & Exit for this Stock
Don't leave your profits to chance. Historically, this stock follows specific seasonal patterns that institutional traders use to maximize returns.
- ✅ Identify the "Golden Buying Window"
- ✅ Avoid high-risk correction cycles
- ✅ Backtested data from the last 20+ years