January 15, 2026 a 04:28 am
CADCHF: Trend and Support & Resistance Analysis
The CADCHF currency pair has shown varying trends in recent months. Analyzing the price movements, one can observe certain patterns that are indicative of future movements. This analysis will focus on identifying the current trend direction, support, and resistance zones that are significant for traders and investors. The insights derived from this analysis can aid in making informed trading decisions in this currency pair.
Trend Analysis
| Date | Close Price | Trend |
|---|---|---|
| 2026-01-15 | 0.57637 | ⚖️ |
| 2026-01-14 | 0.57599 | ⚖️ |
| 2026-01-13 | 0.57657 | ⚖️ |
| 2026-01-12 | 0.57459 | ⚖️ |
| 2026-01-11 | 0.57606 | ⚖️ |
| 2026-01-09 | 0.57543 | ⚖️ |
| 2026-01-08 | 0.57603 | ⚖️ |
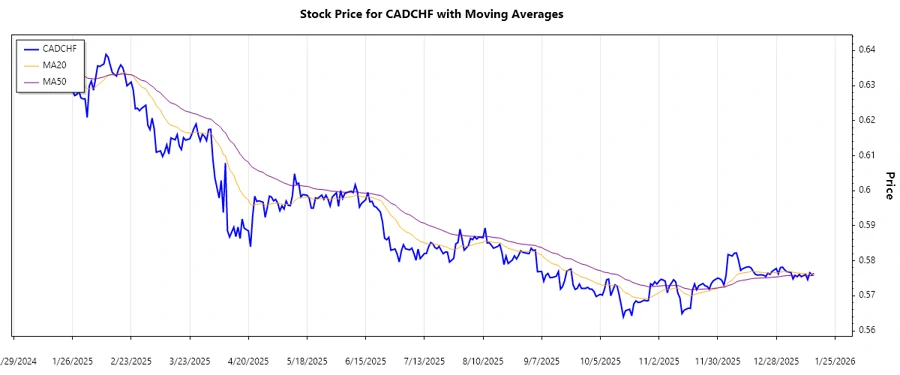
The recent analysis shows a sideways trend as the EMA20 is approximately equal to the EMA50, indicating a lack of a clear directional movement in the CADCHF currency pair.
Support and Resistance
| Zone Type | From (Price) | To (Price) |
|---|---|---|
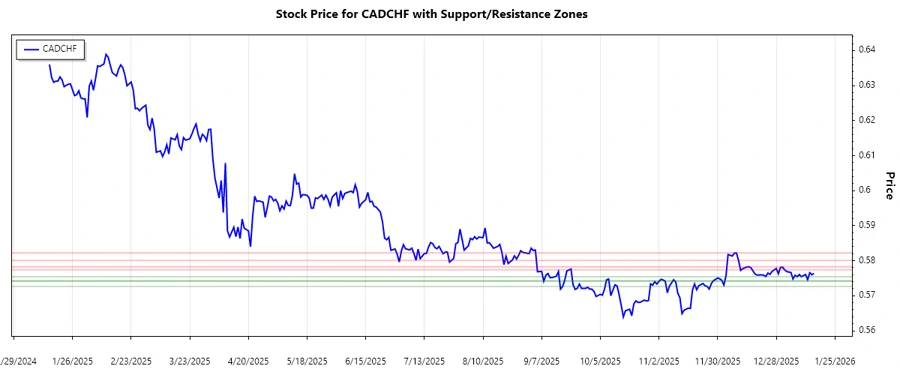
| Support | 0.57429 | 0.57543 |
| Support | 0.57263 | 0.57414 |
| Resistance | 0.5774 | 0.57826 |
| Resistance | 0.58006 | 0.58220 |
Currently, the CADCHF is oscillating near the support zone between 0.57429 and 0.57543, suggesting buying interest at this level. If the price breaks below, it might target the next support zone.
Conclusion
The CADCHF appears to be in a neutral phase with no strong directional bias as noted with the EMAs indicating a sideways trend. The currency is currently near an important support level, which might provide upward momentum if sustained. However, caution is warranted due to volatility that could lead to further decline if the support breaks. Analysts should monitor these levels for potential breakout or reversal patterns to identify trading opportunities.