July 10, 2025 a 04:28 am
CADCHF: Trend and Support & Resistance Analysis
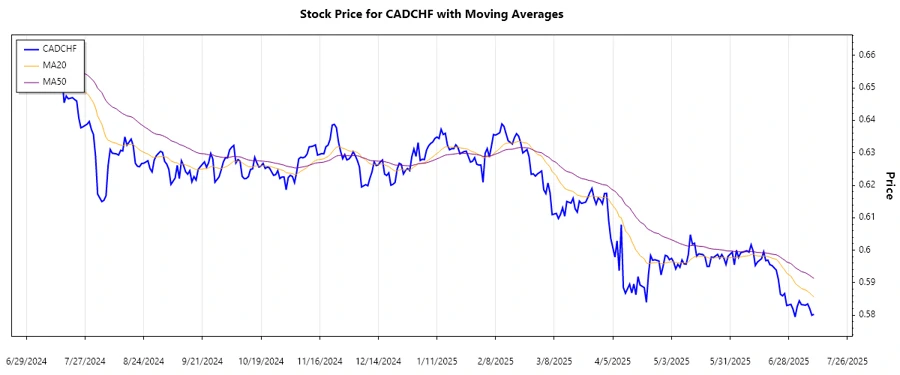
The CADCHF currency pair has been experiencing a downward trend in recent months. This trend is characterized by lower highs and lower lows, indicating bearish pressure. Key support levels have been tested recently, yet the pair continues to exhibit weakness. This analysis focuses on identifying potential trend reversals or continuations by utilizing EMA calculations and significant support and resistance zones. Understanding these technical levels is crucial for predicting CADCHF's future direction.
Trend Analysis
Upon analyzing the recent data, it is evident that the CADCHF pair has been trending downward. The exponential moving averages (EMA) for the 20-day and 50-day periods have been calculated to assess the trend strength. The EMA20 is found to be lower than the EMA50, confirming the bearish trend.
| Date | Close Price | Trend |
|---|---|---|
| 2025-07-10 | 0.58029 | ▼ |
| 2025-07-09 | 0.57997 | ▼ |
| 2025-07-08 | 0.58198 | ▼ |
| 2025-07-07 | 0.58347 | ▼ |
| 2025-07-06 | 0.58309 | ▼ |
| 2025-07-04 | 0.58327 | ▼ |
| 2025-07-03 | 0.58444 | ▼ |
The trend analysis suggests that CADCHF is in a continued downtrend. Technical indicators highlight bearish signals as the EMA20 remains below the EMA50.
Support and Resistance
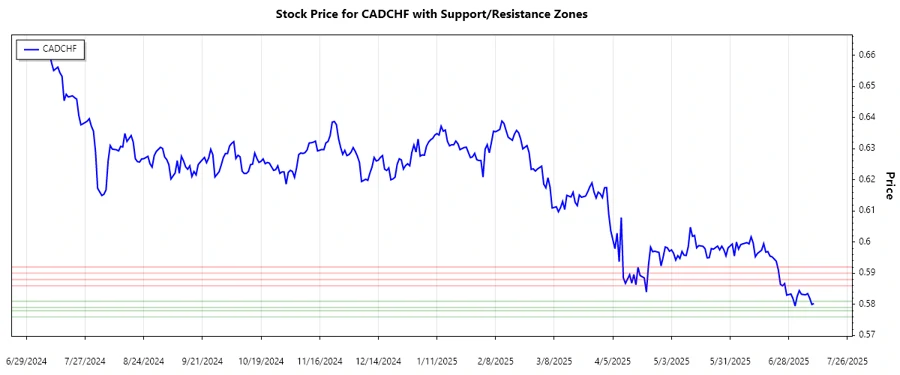
Identifying key support and resistance zones is essential for understanding potential price reversals or continuations. For CADCHF, critical support and resistance levels have been calculated based on recent price actions.
| Zone Type | From | To |
|---|---|---|
| Support 1 | 0.57900 | 0.58100 |
| Support 2 | 0.57600 | 0.57800 |
| Resistance 1 | 0.58600 | 0.58800 |
| Resistance 2 | 0.59000 | 0.59200 |
Currently, the CADCHF price is approaching the lower support zone (Support 1), indicating possible consolidation or a further decline if this level fails to hold.
Conclusion
The CADCHF has been demonstrating a persistent downward trend, confirmed by EMA indicators. The key support and resistance zones identified provide essential insights into potential price reversals. Currently, CADCHF is nearing a significant support zone, which may offer a temporary halt to this bearish trend. However, if this support is breached, further downside can be expected. Investors should closely watch these technical indicators for possible entry or exit points. The bearish trend poses risks, yet the identified support levels might offer temporary stability or possible reversal opportunities.
Smart Data Insight
Master the Perfect Entry & Exit for this Stock
Don't leave your profits to chance. Historically, this stock follows specific seasonal patterns that institutional traders use to maximize returns.
- ✅ Identify the "Golden Buying Window"
- ✅ Avoid high-risk correction cycles
- ✅ Backtested data from the last 20+ years