
June 26, 2026 a 05:08 am
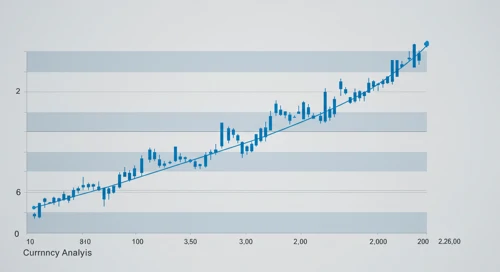

CADCHF: Fibonacci Analysis
The CADCHF currency pair has experienced notable volatility, reflecting diverse economic conditions in Canada and Switzerland. Factors such as commodity prices, trade balances, and monetary policies significantly influence this pair. Recently, the trend has been predominantly downward, indicating considerable pressure on the Canadian dollar. This analysis will delve into the Fibonacci retracement levels, providing insights into potential market re-entry points.
Fibonacci Analysis
Through a detailed examination of historical data, the CADCHF pair has demonstrated a clear downward trend. This decline started on August 11, 2025, with a high of 0.58935 and reached its lowest point on June 26, 2026, at a price of 0.5698. As of the latest data, the current price is positioned at 0.5698. Fibonacci retracement levels calculated from this trend provide critical support and resistance levels, aiding traders to potentially identify strategic market positions.
| Period | Price Level |
|---|---|
| 0% (Low) - June 26, 2026 | 0.5698 |
| 23.6% | 0.5747 |
| 38.2% | 0.5775 |
| 50.0% | 0.5796 |
| 61.8% | 0.5817 |
| 78.6% | 0.5843 |
| 100% (High) - August 11, 2025 | 0.58935 |
The current price is below the 0.236 retracement level, indicating that it is not within a typical retracement zone. As such, this trend suggests resistance near the calculated retracement levels, potentially leading to short-term selling opportunities.
Conclusion
The Fibonacci analysis highlights key levels for potential resistance as the CADCHF pair undergoes market corrections. Currently, risks remain skewed to a further downside as the pair is yet to breach significant retracement zones. For traders, this requires caution as the currency might exhibit further depreciation unless economic indicators favor the Canadian dollar. Monitoring economic releases and central bank policies will be critical in assessing future price movements for CADCHF.
Smart Data Insight
Master the Perfect Entry & Exit for this Stock
Don't leave your profits to chance. Historically, this stock follows specific seasonal patterns that institutional traders use to maximize returns.
- ✅ Identify the "Golden Buying Window"
- ✅ Avoid high-risk correction cycles
- ✅ Backtested data from the last 20+ years