March 01, 2026 a 05:08 am
CADCHF: Fibonacci Analysis
The CADCHF currency pair has been experiencing fluctuations influenced by macroeconomic factors and geopolitical events. Recent data indicates some volatility, with a notable trend observed in the last few months. This analysis aims to identify the potential support and resistance levels using Fibonacci retracement to offer insights for traders and analysts looking to navigate this currency pair's movements.
Fibonacci Analysis
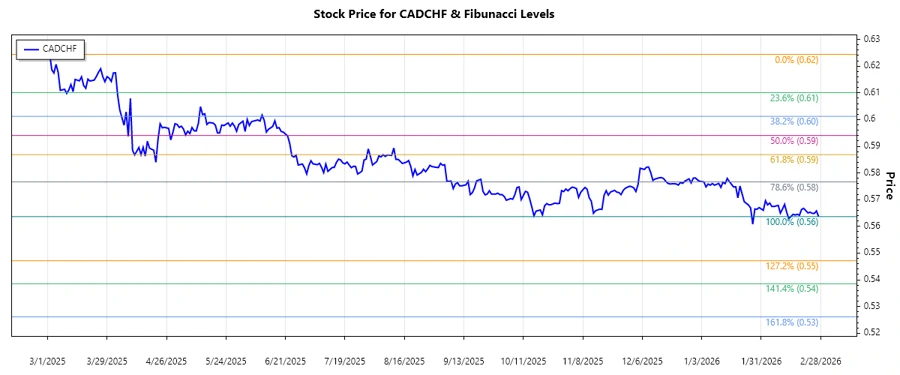
Analyzing the data, the CADCHF has shown a predominant downtrend over recent months. Starting from a high of 0.6244 on March 2, 2025, the price moved to a low of 0.56365 on February 27, 2026. This downtrend presents an opportunity to apply Fibonacci retracement levels to identify key areas where the price might experience a reversal or a temporary support/resistance.
| Trend Start Date | Trend End Date | High (Price/Date) | Low (Price/Date) |
|---|---|---|---|
| 2025-03-02 | 2026-02-27 | 0.6244 / 2025-03-02 | 0.56365 / 2026-02-27 |
| Retracement Level | Price Level |
|---|---|
| 0.236 | 0.5792 |
| 0.382 | 0.5899 |
| 0.5 | 0.5940 |
| 0.618 | 0.5982 |
| 0.786 | 0.6041 |
Currently, the price is close to 0.565, indicating that it is outside the primary retracement zones. Therefore, no immediate retracement level is being tested. Possible technical interpretations suggest the trend might continue downwards until further support levels are tested.
Conclusion
The CADCHF currency analysis reveals a significant downtrend, offering a potential opportunity for traders to capitalize on short positions. However, caution is advised as economic events could abruptly change the direction. The Fibonacci retracement levels serve as critical technical indicators, suggesting potential resistance levels at 0.5899 and higher if the price rebounds. Traders should remain vigilant, observing these levels for potential reversal or continuation signals. Overall, the analysis provides a technical foundation for informed decision-making amidst inherent market risks.