August 26, 2025 a 05:08 am
CADCHF: Fibonacci Analysis
The CADCHF forex pair, representing the Canadian Dollar against the Swiss Franc, has shown interesting movement patterns recently. As global economic factors influence currency strength, traders and analysts should closely monitor the recent trends to make informed decisions. With the current data, we aim to delve into the most recent trend, utilizing Fibonacci retracement levels to predict potential support and resistance areas.
Fibonacci Analysis
| Parameter | Details |
|---|---|
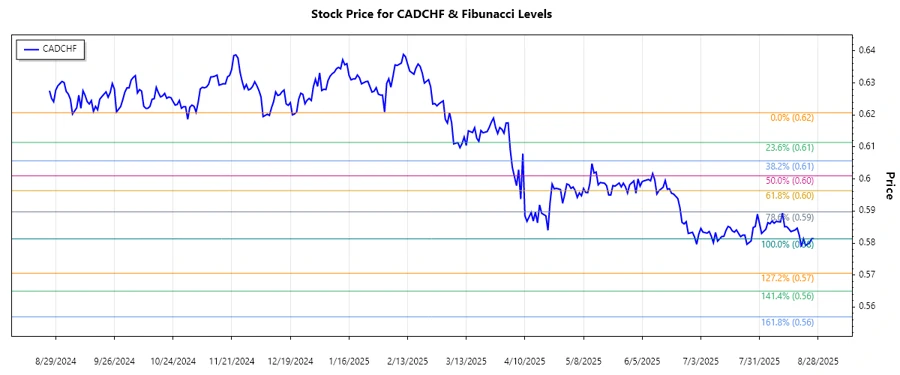
| Trend Start Date | 2025-03-05 |
| Trend End Date | 2025-08-25 |
| High Point | 0.62069 on 2025-03-05 |
| Low Point | 0.58129 on 2025-08-21 |
| Fibonacci Levels |
|
| Current Price | 0.58137 |
| Retracement Zone | Below 0.236 |
| Technical Interpretation | The current price is below all significant retracement levels, suggesting potential resistance in approaching these Fibonacci points before any considerable upward movement. |
Conclusion
The analysis indicates a bearish trend for the CADCHF pair, with the recent low challenging the continuation of downward movement. Given the proximity to the 0.236 Fibonacci level, any potential upward movement may face resistance first at this initial retracement level before any upward breakthrough. Analysts should keenly observe these retracement levels for identifying potential reversal points or additional downtrends. The currency pair remains sensitive to global events, presenting both opportunities for capitalizing on short positions and risks if unforeseen upward momentum gains strength.
Smart Data Insight
Master the Perfect Entry & Exit for this Stock
Don't leave your profits to chance. Historically, this stock follows specific seasonal patterns that institutional traders use to maximize returns.
- ✅ Identify the "Golden Buying Window"
- ✅ Avoid high-risk correction cycles
- ✅ Backtested data from the last 20+ years