
April 30, 2026 a 12:32 pm


Bonds - Performance Analysis
📊 In the current bond market landscape, performance analysis over varying timeframes reveals critical insights and trends. As global economic factors shift, bond ETFs have responded in various ways, with both strategic opportunities and challenges for investors. Let's explore the intricate movements of these bonds over one week, one month, and three months.
Bonds Performance One Week
📈 In the past week, bond performance has been largely negative across the spectrum. The market showed a consistent trend towards losses, with the most significant decline in the 20+ Year Treasury Bond ETFs. The High Yield Corporate Bond ETF and the TIPS Bond ETF showed relatively better resilience, albeit still in negative territory.
| Bond | Performance (%) | Performance |
|---|---|---|
| 1-3 Year Treasury Bond ETF | -0.10% | |
| TIPS Bond ETF | -0.16% | |
| High Yield Corporate Bond ETF | -0.30% | |
| 3-7 Year Treasury Bond ETF | -0.38% | |
| 7-10 Year Treasury Bond ETF | -0.59% | |
| 10-20 Year Treasury Bond ETF | -0.92% | |
| 20+ Year Treasury Bond ETF | -1.00% |
Bonds Performance One Month
🔍 Over the past month, an interesting divergence is noted with the TIPS and High Yield Corporate Bond ETFs exhibiting positive performance, likely attributable to inflation protection and higher yield attractions. On the other hand, most Treasury Bond ETFs have underperformed, with the longest duration bonds experiencing steeper declines.
| Bond | Performance (%) | Performance |
|---|---|---|
| TIPS Bond ETF | 0.92% | |
| High Yield Corporate Bond ETF | 0.72% | |
| 1-3 Year Treasury Bond ETF | -0.23% | |
| 3-7 Year Treasury Bond ETF | -0.47% | |
| 7-10 Year Treasury Bond ETF | -0.67% | |
| 10-20 Year Treasury Bond ETF | -0.93% | |
| 20+ Year Treasury Bond ETF | -1.14% |
Bonds Performance Three Months
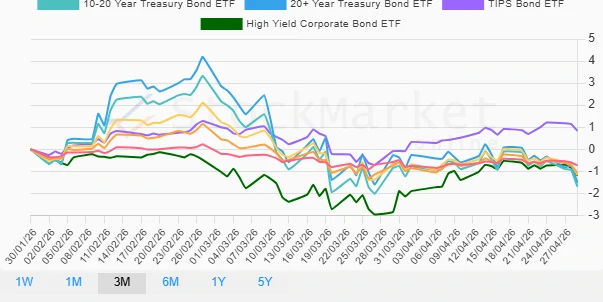
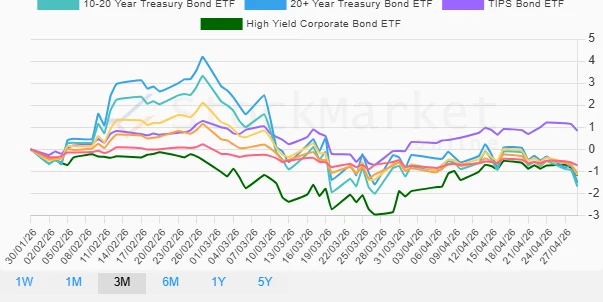
📉 Examining the three-month performance reveals extended challenges for Treasury Bond ETFs, particularly those with medium to longer durations. The ongoing pressures from increasing interest rates and inflation expectations have likely exacerbated these impacts. Conversely, TIPS Bond ETF's positive performance underscores the value of inflation protection in this volatile environment.
| Bond | Performance (%) | Performance |
|---|---|---|
| TIPS Bond ETF | 0.84% | |
| 1-3 Year Treasury Bond ETF | -0.73% | |
| 3-7 Year Treasury Bond ETF | -1.07% | |
| 7-10 Year Treasury Bond ETF | -1.16% | |
| High Yield Corporate Bond ETF | -1.18% | |
| 20+ Year Treasury Bond ETF | -1.51% | |
| 10-20 Year Treasury Bond ETF | -1.69% |
Summary
💡 The current bond market performance across these time frames reflects the complexities of navigating an environment characterized by inflationary pressures and interest rate adjustments. Treasury Bond ETFs, particularly those with longer durations, have faced considerable challenges. Conversely, the TIPS Bond ETF has offered a safe haven through inflation-adjusted returns. Investors are encouraged to consider these dynamics as they strategize their bond allocations, weighing the trade-offs between security and potential returns in the context of current macroeconomic trends.
Smart Data Insight
Master the Perfect Entry & Exit for this Stock
Don't leave your profits to chance. Historically, this stock follows specific seasonal patterns that institutional traders use to maximize returns.
- ✅ Identify the "Golden Buying Window"
- ✅ Avoid high-risk correction cycles
- ✅ Backtested data from the last 20+ years