
October 29, 2026 a 12:31 pm


Bonds - Performance Analysis
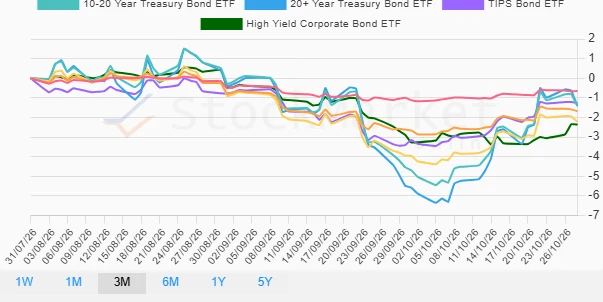
In the evaluation of bond performance over the periods of one week, one month, and three months, notable fluctuations are evident across various bond categories. Short-term volatility contrasts with mid-term recoveries, as evidenced by performance patterns. Potential risks and opportunities have been identified, especially in the context of fluctuating interest rates influencing bond yields. 📊 Immediate focus is advised on macroeconomic factors guiding these trends.
Bonds Performance One Week
| Bond | Performance (%) | Performance |
|---|---|---|
| High Yield Corporate Bond ETF | 0.64 | |
| 1-3 Year Treasury Bond ETF | -0.06 | |
| TIPS Bond ETF | -0.06 | |
| 3-7 Year Treasury Bond ETF | -0.24 | |
| 7-10 Year Treasury Bond ETF | -0.37 | |
| 10-20 Year Treasury Bond ETF | -0.73 | |
| 20+ Year Treasury Bond ETF | -0.91 |
Bonds Performance One Month
| Bond | Performance (%) | Performance |
|---|---|---|
| 20+ Year Treasury Bond ETF | 3.50 | |
| 10-20 Year Treasury Bond ETF | 2.78 | |
| TIPS Bond ETF | 2.17 | |
| 7-10 Year Treasury Bond ETF | 1.57 | |
| 3-7 Year Treasury Bond ETF | 0.90 | |
| 1-3 Year Treasury Bond ETF | 0.40 | |
| High Yield Corporate Bond ETF | 0.33 |
Bonds Performance Three Months
| Bond | Performance (%) | Performance |
|---|---|---|
| High Yield Corporate Bond ETF | -2.36 | |
| 7-10 Year Treasury Bond ETF | -2.22 | |
| 3-7 Year Treasury Bond ETF | -1.68 | |
| 10-20 Year Treasury Bond ETF | -1.41 | |
| 20+ Year Treasury Bond ETF | -1.41 | |
| TIPS Bond ETF | -1.27 | |
| 1-3 Year Treasury Bond ETF | -0.65 |
Summary
The bond market shows pronounced volatility across diverse periods. 📈 Short-term performances portray negativity except for High Yield Corporate Bonds, indicating risk tolerance among investors. Conversely, the one-month analysis reveals recovery prospects, particularly in long-duration bonds, reflecting potential shifts in interest rate outlooks. 📉 The three-month illustration, overwhelmingly negative, suggests sustained pressure and heightened volatility. Investors are advised to scrutinize macroeconomic indicators closely, emphasizing strategic adjustments in allocations and risk assessments. 💡 The evolving interest rate environment is pivotal in navigating bond portfolios strategically.
Smart Data Insight
Master the Perfect Entry & Exit for this Stock
Don't leave your profits to chance. Historically, this stock follows specific seasonal patterns that institutional traders use to maximize returns.
- ✅ Identify the "Golden Buying Window"
- ✅ Avoid high-risk correction cycles
- ✅ Backtested data from the last 20+ years