
May 28, 2026 a 12:32 pm


Bonds - Performance Analysis
In the current economic landscape, understanding the performance of various bond ETFs is crucial for informed investment decisions. Over the past weeks, months, and quarters, we've seen fluctuations across different durations and types of bonds, reflecting market sentiments and macroeconomic dynamics. This analysis provides insights into these movements, highlighting top performers and underperformers to guide strategic portfolio decisions. 📊
Bonds Performance One Week 📈
The one-week performance data reveals a generally positive trend with longer-duration Treasury Bonds leading gains. The 20+ Year Treasury Bond ETF has outperformed with a 1.29% increase, signifying investor confidence in long-term government bonds. Meanwhile, TIPS Bond ETFs and other Treasury Bonds have shown moderate improvements. The High Yield Corporate Bond ETF further indicates a mild positive performance, suggesting some risk appetite among investors.
| Bond | Performance (%) | Performance |
|---|---|---|
| 20+ Year Treasury Bond ETF | 1.29 | |
| 10-20 Year Treasury Bond ETF | 1.10 | |
| 7-10 Year Treasury Bond ETF | 0.56 | |
| TIPS Bond ETF | 0.46 | |
| High Yield Corporate Bond ETF | 0.29 | |
| 3-7 Year Treasury Bond ETF | 0.27 | |
| 1-3 Year Treasury Bond ETF | 0.10 |
Bonds Performance One Month 📉
Examining the one-month outlook, there is a distinct trend of negative returns across all bond categories. The declines are most pronounced in longer-duration Treasury Bonds, highlighting increased volatility concerns among investors. With the 20+ Year Treasury Bond ETF down by 1.20%, the broader sentiment appears risk-averse. Even the traditionally stable areas such as TIPS showed a downturn.
| Bond | Performance (%) | Performance |
|---|---|---|
| 20+ Year Treasury Bond ETF | -1.20 | |
| 10-20 Year Treasury Bond ETF | -1.08 | |
| 7-10 Year Treasury Bond ETF | -0.97 | |
| 3-7 Year Treasury Bond ETF | -0.81 | |
| TIPS Bond ETF | -0.76 | |
| High Yield Corporate Bond ETF | -0.34 | |
| 1-3 Year Treasury Bond ETF | -0.33 |
Bonds Performance Three Months 📉
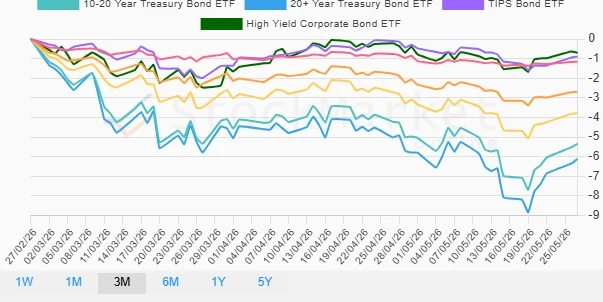
The three-month horizon reflects amplified negative performance, with significant downward shifts in all bond categories. The extended declines in long-duration Treasury Bonds, particularly the 20+ Year Treasury Bond ETF, underscore prevailing market pessimism and rate hike anxieties. Corporate Bonds and shorter-duration Treasury Bonds also echo these concerns, albeit with lesser degrees of decline.
| Bond | Performance (%) | Performance |
|---|---|---|
| 20+ Year Treasury Bond ETF | -6.12 | |
| 10-20 Year Treasury Bond ETF | -5.35 | |
| 7-10 Year Treasury Bond ETF | -3.78 | |
| 3-7 Year Treasury Bond ETF | -2.69 | |
| 1-3 Year Treasury Bond ETF | -1.16 | |
| TIPS Bond ETF | -0.90 | |
| High Yield Corporate Bond ETF | -0.70 |
Summary 💡
The bond market has shown varied dynamics over the past weeks and months. Short-term, bonds experienced modest gains, reflecting stabilization, but over one and three months, there is a clear downtrend, especially in longer-duration bonds. This shift suggests investors are wary of potential interest rate increases and macroeconomic uncertainties. Diversification and caution are advised as these trends may continue impacting bond asset valuations.
Smart Data Insight
Master the Perfect Entry & Exit for this Stock
Don't leave your profits to chance. Historically, this stock follows specific seasonal patterns that institutional traders use to maximize returns.
- ✅ Identify the "Golden Buying Window"
- ✅ Avoid high-risk correction cycles
- ✅ Backtested data from the last 20+ years