June 25, 2026 a 12:32 pm


Bonds - Performance Analysis
📊 The analysis of bond performance over recent weeks reveals significant volatility across different time frames. In the short term, the longer-dated bonds exhibited stronger performance, while shorter-dated and high-yield bonds faced challenges. The intermediate analysis over one month and three months further highlights the dominance of long-term bonds. The insights point to ongoing market dynamics influenced by inflationary pressures and interest rate adjustments.
📈 Bonds Performance One Week
| Bond | Performance (%) | Performance |
|---|---|---|
| 20+ Year Treasury Bond ETF | 0.74 | |
| 10-20 Year Treasury Bond ETF | 0.63 | |
| 7-10 Year Treasury Bond ETF | 0.40 | |
| 3-7 Year Treasury Bond ETF | 0.24 | |
| 1-3 Year Treasury Bond ETF | 0.09 | |
| TIPS Bond ETF | -0.06 | |
| High Yield Corporate Bond ETF | -0.21 |
📉 Bonds Performance One Month
| Bond | Performance (%) | Performance |
|---|---|---|
| 20+ Year Treasury Bond ETF | 2.69 | |
| 10-20 Year Treasury Bond ETF | 1.88 | |
| 7-10 Year Treasury Bond ETF | 0.48 | |
| 3-7 Year Treasury Bond ETF | 0.03 | |
| 1-3 Year Treasury Bond ETF | -0.18 | |
| High Yield Corporate Bond ETF | -0.41 | |
| TIPS Bond ETF | -1.35 |
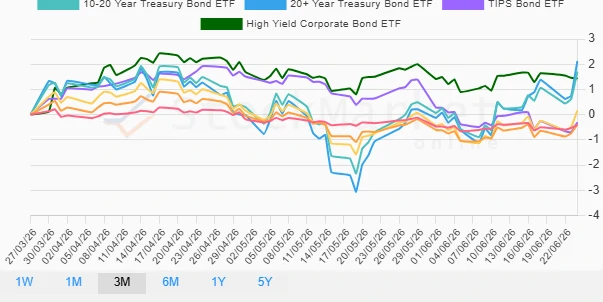
📊 Bonds Performance Three Months
| Bond | Performance (%) | Performance |
|---|---|---|
| 20+ Year Treasury Bond ETF | 2.12 | |
| 10-20 Year Treasury Bond ETF | 1.70 | |
| High Yield Corporate Bond ETF | 1.43 | |
| 7-10 Year Treasury Bond ETF | 0.16 | |
| TIPS Bond ETF | -0.31 | |
| 3-7 Year Treasury Bond ETF | -0.40 | |
| 1-3 Year Treasury Bond ETF | -0.41 |
✅ Summary
💡 Across all time frames examined, the supremacy of long-duration bonds is distinctly evident, reflecting investor sentiment shifting toward securing long-term fixed income in anticipation of potential economic shifts. Conversely, short-duration and high-yield instruments lag, affected by rising rate expectations and inflation forecasts. In summary, vigilance around interest rate trajectories remains crucial for strategizing bond investments amidst prevailing economic indicators.
Smart Data Insight
Master the Perfect Entry & Exit for this Stock
Don't leave your profits to chance. Historically, this stock follows specific seasonal patterns that institutional traders use to maximize returns.
- ✅ Identify the "Golden Buying Window"
- ✅ Avoid high-risk correction cycles
- ✅ Backtested data from the last 20+ years