
September 24, 2026 a 12:31 pm


Bonds - Performance Analysis
Recent months have demonstrated significant volatility in the bond market, largely driven by macroeconomic factors and changing interest rates. This analysis reveals a broader trend of negative performance across various bond categories, with government bonds in particular facing downward pressure. Investors should remain alert to further shifts in market dynamics as future interest rate movements are anticipated.
📊 Bonds Performance One Week
During the last week, bond markets exhibited a general decline in performance, with longer-term Treasury bonds experiencing steeper declines. The "20+ Year Treasury Bond ETF" underperformed the most, indicating increased duration risk aversion among investors.
| Bond | Performance (%) | Performance |
|---|---|---|
| 1-3 Year Treasury Bond ETF | -0.30% | |
| High Yield Corporate Bond ETF | -0.78% | |
| 3-7 Year Treasury Bond ETF | -0.80% | |
| TIPS Bond ETF | -0.85% | |
| 7-10 Year Treasury Bond ETF | -1.15% | |
| 10-20 Year Treasury Bond ETF | -1.55% | |
| 20+ Year Treasury Bond ETF | -1.61% |
📊 Bonds Performance One Month
The monthly analysis paints a similar picture with prolonged weakness in bond prices, predominantly in mid to long duration Treasuries. This reflects consistent pressures from interest rate hikes and inflationary expectations.
| Bond | Performance (%) | Performance |
|---|---|---|
| 1-3 Year Treasury Bond ETF | -1.19% | |
| High Yield Corporate Bond ETF | -2.30% | |
| TIPS Bond ETF | -2.67% | |
| 3-7 Year Treasury Bond ETF | -2.74% | |
| 7-10 Year Treasury Bond ETF | -3.59% | |
| 20+ Year Treasury Bond ETF | -3.62% | |
| 10-20 Year Treasury Bond ETF | -3.73% |
📊 Bonds Performance Three Months
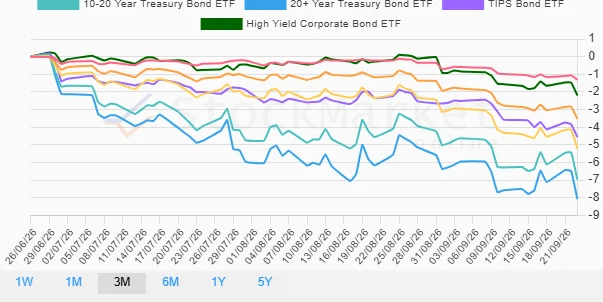
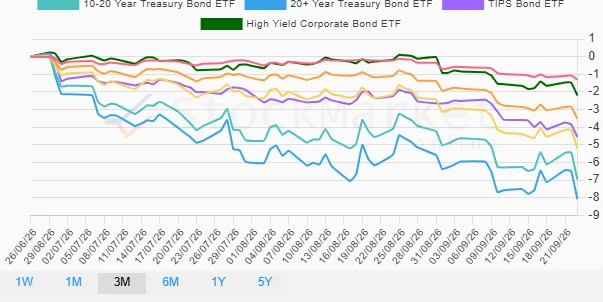
Over the quarter, substantial losses have accumulated, especially in the long-term Treasury sector. This persistent weakness highlights significant challenges posed by the current economic environment, warranting cautious positioning by bond investors.
| Bond | Performance (%) | Performance |
|---|---|---|
| High Yield Corporate Bond ETF | -2.19% | |
| 1-3 Year Treasury Bond ETF | -1.31% | |
| TIPS Bond ETF | -4.55% | |
| 3-7 Year Treasury Bond ETF | -3.52% | |
| 7-10 Year Treasury Bond ETF | -5.20% | |
| 10-20 Year Treasury Bond ETF | -6.96% | |
| 20+ Year Treasury Bond ETF | -8.07% |
✅ Summary
The performance across the bond market in recent weeks and months has been predominantly negative, driven by macroeconomic challenges and interest rate fluctuations. Long-term treasuries have suffered the most, underscoring the duration risk associated with them. Investors are advised to continually assess their portfolios, especially given the anticipated ongoing economic uncertainties. A measured approach focusing on short to intermediate duration bonds might limit exposure to current volatilities.
Smart Data Insight
Master the Perfect Entry & Exit for this Stock
Don't leave your profits to chance. Historically, this stock follows specific seasonal patterns that institutional traders use to maximize returns.
- ✅ Identify the "Golden Buying Window"
- ✅ Avoid high-risk correction cycles
- ✅ Backtested data from the last 20+ years