
July 23, 2026 a 12:32 pm


Bonds - Performance Analysis
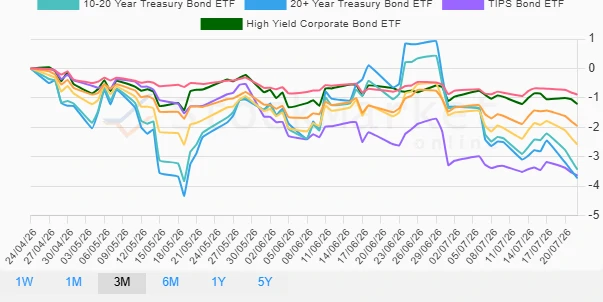
🔍 The bond market continues to experience volatility as investors react to economic shifts and interest rate expectations. Over the past three months, all bond categories have shown negative returns due to rising rates and inflationary pressures. Notably, longer-duration bonds have been more severely impacted compared to short-duration ones.
Bonds Performance One Week 📈
| Bond | Performance (%) | Performance |
|---|---|---|
| TIPS Bond ETF | -0.18% | |
| 1-3 Year Treasury Bond ETF | -0.21% | |
| High Yield Corporate Bond ETF | -0.35% | |
| 3-7 Year Treasury Bond ETF | -0.50% | |
| 7-10 Year Treasury Bond ETF | -0.67% | |
| 20+ Year Treasury Bond ETF | -0.91% | |
| 10-20 Year Treasury Bond ETF | -1.00% |
Bonds Performance One Month 📉
| Bond | Performance (%) | Performance |
|---|---|---|
| 1-3 Year Treasury Bond ETF | -0.17% | |
| High Yield Corporate Bond ETF | -0.45% | |
| TIPS Bond ETF | -1.02% | |
| 3-7 Year Treasury Bond ETF | -0.60% | |
| 7-10 Year Treasury Bond ETF | -1.09% | |
| 10-20 Year Treasury Bond ETF | -2.57% | |
| 20+ Year Treasury Bond ETF | -3.21% |
Bonds Performance Three Months 📉
| Bond | Performance (%) | Performance |
|---|---|---|
| 1-3 Year Treasury Bond ETF | -0.89% | |
| High Yield Corporate Bond ETF | -1.21% | |
| 3-7 Year Treasury Bond ETF | -1.96% | |
| 7-10 Year Treasury Bond ETF | -2.59% | |
| TIPS Bond ETF | -3.64% | |
| 10-20 Year Treasury Bond ETF | -3.44% | |
| 20+ Year Treasury Bond ETF | -3.73% |
Summary ✅
The bond market has shown a consistent downward trend across all time frames evaluated, primarily driven by rising interest rates and inflation fears. Long-duration bonds have suffered the most considerable losses, while short-term bonds and TIPS have shown relatively better resilience. Investors should consider tactical asset allocation, potentially favoring shorter durations or high-yield options until the outlook on interest rates stabilizes. Caution and detailed analysis remain prudent as macroeconomic conditions continue to evolve.
Smart Data Insight
Master the Perfect Entry & Exit for this Stock
Don't leave your profits to chance. Historically, this stock follows specific seasonal patterns that institutional traders use to maximize returns.
- ✅ Identify the "Golden Buying Window"
- ✅ Avoid high-risk correction cycles
- ✅ Backtested data from the last 20+ years