
October 22, 2026 a 12:31 pm

Bonds - Performance Analysis
Analyzing the recent performance of bonds provides insights into market trends and investor sentiment. The data across multiple time ranges reveals fluctuations that reflect both economic pressures and opportunities. Observing these movements helps in strategizing future investment plans, especially in a volatile bond market. The analysis aims to differentiate high-performing bonds from those underperforming, aiding in strategic asset allocation.
Bonds Performance One Week
📊 Over the past week, bond performance has shown a mixed landscape. While longer-dated Treasury Bond ETFs exhibit positive growth, led by the 20+ Year Treasury Bond ETF, some mid-duration and high-yield bonds faced declines. Such short-term fluctuations suggest investor caution amid uncertain economic signals.
| Bond | Performance (%) | Performance |
|---|---|---|
| 20+ Year Treasury Bond ETF | 0.34 | |
| TIPS Bond ETF | 0.25 | |
| 10-20 Year Treasury Bond ETF | 0.19 | |
| 1-3 Year Treasury Bond ETF | 0.01 | |
| 3-7 Year Treasury Bond ETF | -0.10 | |
| 7-10 Year Treasury Bond ETF | -0.13 | |
| High Yield Corporate Bond ETF | -0.19 |
Bonds Performance One Month
📈 The monthly performance unveils a bearish tendency across most categories, particularly in long-duration bonds. The High Yield Corporate Bond ETF stands out with the most substantial decline, accentuating market aversions to higher risk assets.
| Bond | Performance (%) | Performance |
|---|---|---|
| High Yield Corporate Bond ETF | -2.14 | |
| 20+ Year Treasury Bond ETF | -1.84 | |
| 10-20 Year Treasury Bond ETF | -1.66 | |
| 7-10 Year Treasury Bond ETF | -1.01 | |
| 3-7 Year Treasury Bond ETF | -0.45 | |
| 1-3 Year Treasury Bond ETF | -0.02 | |
| TIPS Bond ETF | 0.01 |
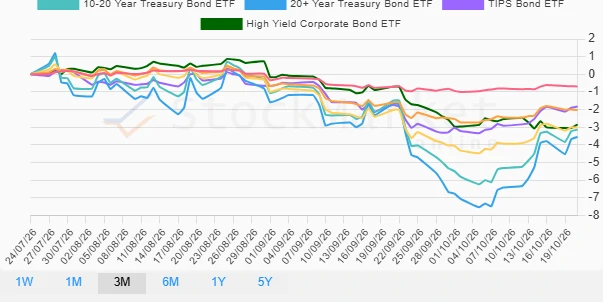
Bonds Performance Three Months
📉 The three-month view reinforces the downward trajectory, with an intensified decline in long-duration bonds. The 20+ Year Treasury Bond ETF experiences the steepest drop, signaling persistent market concerns and a potential reassessment of long-duration risk exposure.
| Bond | Performance (%) | Performance |
|---|---|---|
| 20+ Year Treasury Bond ETF | -3.55 | |
| 10-20 Year Treasury Bond ETF | -3.14 | |
| 7-10 Year Treasury Bond ETF | -3.02 | |
| High Yield Corporate Bond ETF | -2.85 | |
| 3-7 Year Treasury Bond ETF | -2.03 | |
| TIPS Bond ETF | -1.83 | |
| 1-3 Year Treasury Bond ETF | -0.69 |
Summary
🔍 The bond market experienced significant volatility across all observed timeframes, with negative trends more pronounced in long-duration holdings. Over the short term, cautious optimism exists in diversified bond holdings like TIPS, but strategic shifts might be crucial for better adaptability. An informed review of portfolio exposure to long-duration and high-yield bonds is recommended to mitigate risks associated with ongoing economic fluctuations.
Smart Data Insight
Master the Perfect Entry & Exit for this Stock
Don't leave your profits to chance. Historically, this stock follows specific seasonal patterns that institutional traders use to maximize returns.
- ✅ Identify the "Golden Buying Window"
- ✅ Avoid high-risk correction cycles
- ✅ Backtested data from the last 20+ years