May 21, 2026 a 12:31 pm


Bonds - Performance Analysis
Analyzing the recent bond performance allows us to understand market sentiment and anticipate future movements. In this overview, we delve into the weekly, monthly, and quarterly trends in bonds, highlighting both top performers and underperformers. The data-driven insights facilitate a nuanced understanding of the bond market landscape, crucial for informed investment decisions.
Bonds Performance One Week 📊
The one-week analysis reveals compression in bond yields with predominately negative shifts. While the 'High Yield Corporate Bond ETF' marginally advanced by 0.01%, longer-duration bonds faced pressures, witnessing declines up to -1.18%. This indicates potential short-term bearish trends possibly influenced by macroeconomic forces such as interest rate expectations.
| Bond | Performance (%) | Performance |
|---|---|---|
| High Yield Corporate Bond ETF | 0.01 | |
| 1-3 Year Treasury Bond ETF | -0.01 | |
| 3-7 Year Treasury Bond ETF | -0.27 | |
| TIPS Bond ETF | -0.57 | |
| 7-10 Year Treasury Bond ETF | -0.55 | |
| 10-20 Year Treasury Bond ETF | -1.03 | |
| 20+ Year Treasury Bond ETF | -1.18 |
Bonds Performance One Month 📊
The monthly view exhibits a more pronounced decline across bonds. The '20+ Year Treasury Bond ETF' underperforms, decreasing by -3.10%, whereas short-duration bonds like '1-3 Year Treasury Bond ETF' show relative resilience despite a -0.39% drop. This pattern suggests ongoing volatility related to duration risk amid current economic conditions.
| Bond | Performance (%) | Performance |
|---|---|---|
| 1-3 Year Treasury Bond ETF | -0.39 | |
| High Yield Corporate Bond ETF | -0.64 | |
| TIPS Bond ETF | -0.77 | |
| 3-7 Year Treasury Bond ETF | -1.18 | |
| 7-10 Year Treasury Bond ETF | -1.77 | |
| 10-20 Year Treasury Bond ETF | -2.62 | |
| 20+ Year Treasury Bond ETF | -3.10 |
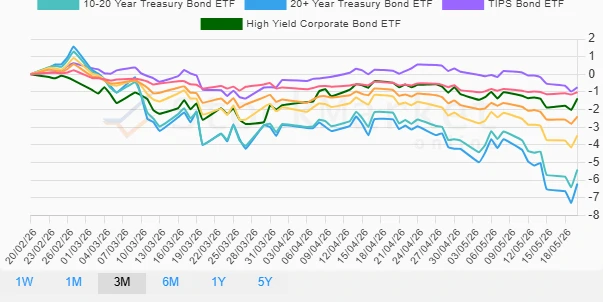
Bonds Performance Three Months 📊
The three-month analysis further emphasizes long-term underperformance, particularly in '20+ Year Treasury Bond ETF' with a significant -6.21% downturn. Bonds with shorter durations fared better but maintain negative performances. The trend may indicate sustained pessimism in long-duration fixed-income assets amidst potential interest rate hikes.
| Bond | Performance (%) | Performance |
|---|---|---|
| TIPS Bond ETF | -0.74 | |
| 1-3 Year Treasury Bond ETF | -1.02 | |
| High Yield Corporate Bond ETF | -1.38 | |
| 3-7 Year Treasury Bond ETF | -2.40 | |
| 7-10 Year Treasury Bond ETF | -3.47 | |
| 10-20 Year Treasury Bond ETF | -5.41 | |
| 20+ Year Treasury Bond ETF | -6.21 |
Summary ✅
Across varying timeframes, the bond market has predominantly witnessed declines, especially in longer-duration treasury bonds. Shorter maturities display more resilience but are not immune to the downtrend. This suggests caution for investors favoring long-duration fixed-income assets amidst the possibility of rising interest rates and resultant yield adjustments. A considered approach may involve rebalancing allocations from long to shorter-duration bonds to mitigate duration risk.
Smart Data Insight
Master the Perfect Entry & Exit for this Stock
Don't leave your profits to chance. Historically, this stock follows specific seasonal patterns that institutional traders use to maximize returns.
- ✅ Identify the "Golden Buying Window"
- ✅ Avoid high-risk correction cycles
- ✅ Backtested data from the last 20+ years