November 20, 2025 a 12:32 pm


Bonds - Performance Analysis
Analyzing recent bond market trends reveals significant performance variances across different timeframes, highlighting the impacts of macroeconomic factors on bond yields and prices. The one-week period shows minor shifts, while the one-month span reflects marked volatility, largely negative. In contrast, the three-month performance suggests a rebound, indicating potential recovery or stabilization trends in longer-dated treasuries.
Bonds Performance One Week 📊
Investors witnessed varied performances over the past week, with shorter-term treasuries experiencing modest gains, while longer-dated treasuries and TIPS exhibited declines. Notably, the 20+ Year Treasury Bond ETF underperformed, suggesting shifts in long-term yield curves.
| Bond | Performance (%) | Performance |
|---|---|---|
| 3-7 Year Treasury Bond ETF | 0.09 | |
| 1-3 Year Treasury Bond ETF | 0.08 | |
| 7-10 Year Treasury Bond ETF | 0.04 | |
| High Yield Corporate Bond ETF | -0.07 | |
| TIPS Bond ETF | -0.16 | |
| 10-20 Year Treasury Bond ETF | -0.33 | |
| 20+ Year Treasury Bond ETF | -0.55 |
Bonds Performance One Month 📉
Over the past month, bond performance has largely trended negatively, with the 20+ Year Treasury Bond ETF experiencing the steepest decline. This period was characterized by heightened volatility, influenced heavily by shifts in inflation expectations and monetary policy stances.
| Bond | Performance (%) | Performance |
|---|---|---|
| 1-3 Year Treasury Bond ETF | -0.29 | |
| 3-7 Year Treasury Bond ETF | -0.63 | |
| High Yield Corporate Bond ETF | -0.77 | |
| 7-10 Year Treasury Bond ETF | -1.10 | |
| TIPS Bond ETF | -1.19 | |
| 10-20 Year Treasury Bond ETF | -2.38 | |
| 20+ Year Treasury Bond ETF | -3.40 |
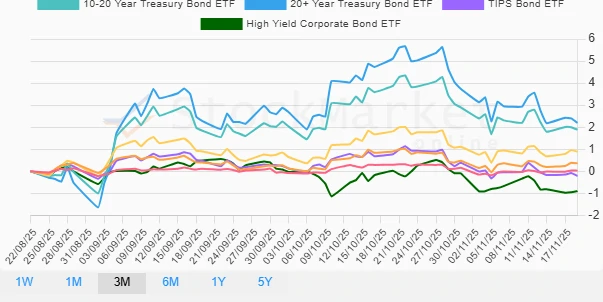
Bonds Performance Three Months 📈
In a stark contrast to the shorter-term data, the three-month analysis reveals a notable recovery across longer-term treasuries. The 20+ Year Treasury Bond ETF led the gains, reflecting renewed investor confidence amidst evolving fiscal and economic policies.
| Bond | Performance (%) | Performance |
|---|---|---|
| 20+ Year Treasury Bond ETF | 2.20 | |
| 10-20 Year Treasury Bond ETF | 1.89 | |
| 7-10 Year Treasury Bond ETF | 0.89 | |
| 3-7 Year Treasury Bond ETF | 0.36 | |
| 1-3 Year Treasury Bond ETF | 0.03 | |
| TIPS Bond ETF | -0.21 | |
| High Yield Corporate Bond ETF | -0.90 |
Summary 🗣️
Across different timeframes, bond performance reflects underlying macroeconomic trends and investor sentiment. The recent uptick in longer-term bonds suggests a positive recalibration in market expectations, likely driven by economic policy signals and long-term inflation expectations. Shorter-term negative trends indicate caution concerning immediate economic shifts. Investors should closely monitor monetary policy announcements as these can significantly influence bond market dynamics.
Smart Data Insight
Master the Perfect Entry & Exit for this Stock
Don't leave your profits to chance. Historically, this stock follows specific seasonal patterns that institutional traders use to maximize returns.
- ✅ Identify the "Golden Buying Window"
- ✅ Avoid high-risk correction cycles
- ✅ Backtested data from the last 20+ years