
August 20, 2026 a 12:32 pm


Bonds - Performance Analysis
The bond market has experienced notable volatility over the past few months, with short-term and long-term bond performances diverging significantly. The analysis of weekly, monthly, and quarterly data provides insight into current trends and potential future movements. Pay close attention to the inflation-protected securities and long-duration bonds which have shown mixed results amidst fluctuating interest rates.
Bonds Performance One Week 📊
The one-week bond performance indicates a positive trend for longer-duration bonds, while shorter and medium-term investments show slight gains or losses. The standouts this week are the 10-20 Year and 20+ Year Treasury Bond ETFs.
| Bond | Performance (%) | Performance |
|---|---|---|
| 20+ Year Treasury Bond ETF | 0.54 | |
| 10-20 Year Treasury Bond ETF | 0.51 | |
| TIPS Bond ETF | 0.32 | |
| 7-10 Year Treasury Bond ETF | 0.09 | |
| 1-3 Year Treasury Bond ETF | 0.03 | |
| 3-7 Year Treasury Bond ETF | -0.01 | |
| High Yield Corporate Bond ETF | -0.10 |
Bonds Performance One Month 📈
Monthly performances reflect varied movements, with shorter-duration bonds yielding modest gains, whereas longer-duration bonds such as the 20+ Year Treasury experienced notable losses. Inflation-protected securities underperformed, indicating inflationary pressures.
| Bond | Performance (%) | Performance |
|---|---|---|
| 1-3 Year Treasury Bond ETF | 0.21 | |
| 3-7 Year Treasury Bond ETF | 0.19 | |
| High Yield Corporate Bond ETF | 0.09 | |
| 7-10 Year Treasury Bond ETF | 0.07 | |
| 10-20 Year Treasury Bond ETF | -0.14 | |
| TIPS Bond ETF | -0.35 | |
| 20+ Year Treasury Bond ETF | -0.70 |
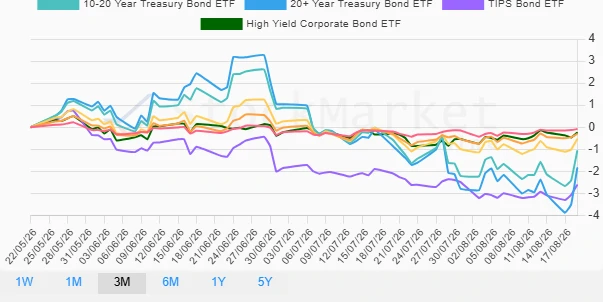
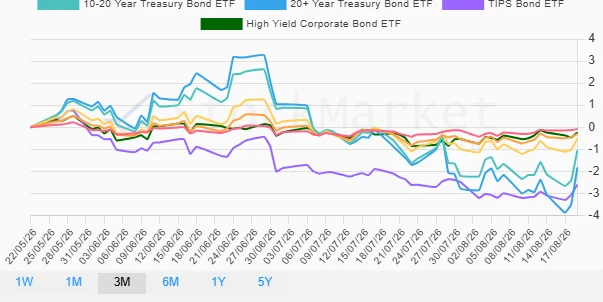
Bonds Performance Three Months 📉
The quarterly view exposes significant challenges across all bonds, with considerable underperformance, particularly in inflation-protected and long-duration bonds. The rising interest rate environment continues to exert pressure on bond valuations.
| Bond | Performance (%) | Performance |
|---|---|---|
| 1-3 Year Treasury Bond ETF | -0.08 | |
| High Yield Corporate Bond ETF | -0.24 | |
| 3-7 Year Treasury Bond ETF | -0.30 | |
| 7-10 Year Treasury Bond ETF | -0.53 | |
| 10-20 Year Treasury Bond ETF | -1.06 | |
| 20+ Year Treasury Bond ETF | -1.83 | |
| TIPS Bond ETF | -2.61 |
Summary 🔍
The analysis over various time frames indicates that longer-duration bonds encounter pronounced volatility, primarily influenced by expectations of rising interest rates. Despite short-term stability in certain sectors, the overarching narrative is one of caution, particularly for TIPS and long-duration Treasury bonds, which have recently underperformed. Investors should consider interest rate trajectories and inflationary concerns when adjusting their portfolios.
Smart Data Insight
Master the Perfect Entry & Exit for this Stock
Don't leave your profits to chance. Historically, this stock follows specific seasonal patterns that institutional traders use to maximize returns.
- ✅ Identify the "Golden Buying Window"
- ✅ Avoid high-risk correction cycles
- ✅ Backtested data from the last 20+ years