
November 19, 2026 a 12:31 pm


Bonds - Performance Analysis
In the midst of a fluctuating market, bond performances have exhibited diverse trends across various durations. Our analysis will dissect the trajectories over one week, one month, and three months to provide clear insights into top performers and those requiring cautious observation. Strategic decisions must be made based on these revelations.
📊 Bonds Performance One Week
In the past week, Treasury Bonds have generally shown positive movements, with the 20+ Year Treasury Bond ETF standing out as the top performer. In contrast, High Yield Corporate Bonds have underperformed, hinting at potential market uncertainties or sectoral risks.
| Bond | Performance (%) | Performance |
|---|---|---|
| 20+ Year Treasury Bond ETF | 0.62 | |
| 10-20 Year Treasury Bond ETF | 0.55 | |
| 7-10 Year Treasury Bond ETF | 0.51 | |
| 3-7 Year Treasury Bond ETF | 0.42 | |
| 1-3 Year Treasury Bond ETF | 0.24 | |
| TIPS Bond ETF | 0.13 | |
| High Yield Corporate Bond ETF | -0.42 |
📈 Bonds Performance One Month
The monthly analysis reveals a more diverse picture with the 7-10 Year Treasury Bond ETF as the lead, showing robust returns. However, TIPS struggled during the month, reflecting inflationary pressures or market dynamics impacting inflation-protected securities.
| Bond | Performance (%) | Performance |
|---|---|---|
| 7-10 Year Treasury Bond ETF | 0.51 | |
| 10-20 Year Treasury Bond ETF | 0.39 | |
| 3-7 Year Treasury Bond ETF | 0.30 | |
| 20+ Year Treasury Bond ETF | 0.18 | |
| 1-3 Year Treasury Bond ETF | 0.06 | |
| High Yield Corporate Bond ETF | -0.20 | |
| TIPS Bond ETF | -0.54 |
📉 Bonds Performance Three Months
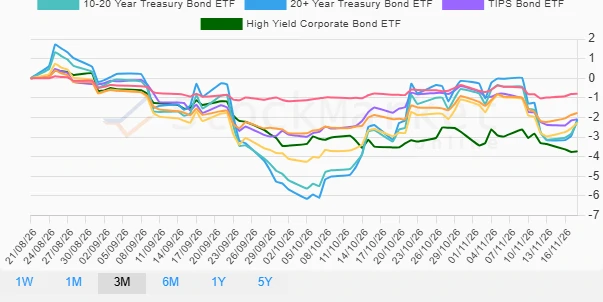
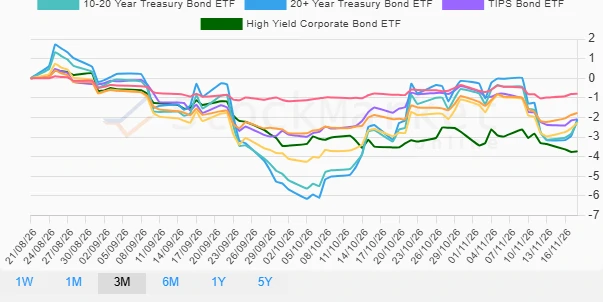
A quarter-long view reveals overall negative trends across the bond spectrum, with High Yield Corporate Bonds as the substantial underperformer. Distinctively, this decline across the board might be attributed to broader economic constraints, interest rate movements, or investor risk appetites receding.
| Bond | Performance (%) | Performance |
|---|---|---|
| High Yield Corporate Bond ETF | -3.73 | |
| 7-10 Year Treasury Bond ETF | -2.27 | |
| 10-20 Year Treasury Bond ETF | -2.23 | |
| 20+ Year Treasury Bond ETF | -2.11 | |
| TIPS Bond ETF | -2.09 | |
| 3-7 Year Treasury Bond ETF | -1.77 | |
| 1-3 Year Treasury Bond ETF | -0.79 |
✅ Summary
In conclusion, the bond market shows variances influenced heavily by macroeconomic factors and investor sentiment over different periods. Treasury Bonds have generally outperformed High Yield Corporate Bonds, which reflect sectoral or credit risks. While short-term metrics show potential gains in Treasury Bonds, longer horizons display bearish pressures. Decision-makers should balance immediate yields with long-term expectations. Vigilance in monitoring economic indicators will be crucial in navigating future changes.
Smart Data Insight
Master the Perfect Entry & Exit for this Stock
Don't leave your profits to chance. Historically, this stock follows specific seasonal patterns that institutional traders use to maximize returns.
- ✅ Identify the "Golden Buying Window"
- ✅ Avoid high-risk correction cycles
- ✅ Backtested data from the last 20+ years