
June 18, 2026 a 12:31 pm


Bonds - Performance Analysis
As we delve into the latest performance metrics of bond ETFs over different time horizons, the data reveals intriguing shifts and influences across varying terms. In this analysis, key performers and significant movers within the one-week, one-month, and three-month periods are dissected. This provides invaluable insights for market participants aiming to align their strategic perspectives with prevailing trends. Let us explore these dynamics further. 📊
Bonds Performance One Week
The one-week performance analysis of bond ETFs illustrates a varied landscape, primarily dominated by a marginal downward trend, with a few exceptions. The long-duration treasury bonds outshine with positive yields, demonstrating better stability amidst market fluctuations. Meanwhile, TIPS and mid-term treasury bonds reflect subtle setbacks. Here is a detailed layout of the weekly performance:
| Bond | Performance (%) | Performance |
|---|---|---|
| 20+ Year Treasury Bond ETF | 0.41% | |
| 10-20 Year Treasury Bond ETF | 0.05% | |
| 1-3 Year Treasury Bond ETF | -0.25% | |
| High Yield Corporate Bond ETF | -0.25% | |
| 7-10 Year Treasury Bond ETF | -0.34% | |
| 3-7 Year Treasury Bond ETF | -0.38% | |
| TIPS Bond ETF | -0.52% |
Bonds Performance One Month
Transitioning to a broader horizon, the one-month bond performance analysis unveils a substantial recovery trajectory, particularly among long-duration treasury bonds. With 20+ Year Treasuries leading the resurgence, positive returns are pronounced, while TIPS continue facing a drag. The monthly landscape reflects resilience and optimism as follows:
| Bond | Performance (%) | Performance |
|---|---|---|
| 20+ Year Treasury Bond ETF | 3.95% | |
| 10-20 Year Treasury Bond ETF | 2.89% | |
| 7-10 Year Treasury Bond ETF | 0.98% | |
| High Yield Corporate Bond ETF | 0.49% | |
| 3-7 Year Treasury Bond ETF | 0.20% | |
| 1-3 Year Treasury Bond ETF | -0.19% | |
| TIPS Bond ETF | -0.97% |
Bonds Performance Three Months
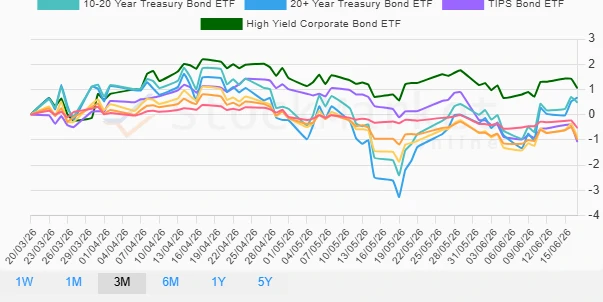
Over the expansive three-month frame, the bullish stance among high-yield corporates stands out distinctively, contrasting sharply against mixed treasury yields. The high-yield sector highlights its robustness with leading profits, amid subdued governmental bond patterns. Analysis below emphasizes on this strategic differentiation:
| Bond | Performance (%) | Performance |
|---|---|---|
| High Yield Corporate Bond ETF | 1.05% | |
| 20+ Year Treasury Bond ETF | 0.68% | |
| 10-20 Year Treasury Bond ETF | 0.48% | |
| 7-10 Year Treasury Bond ETF | -0.89% | |
| TIPS Bond ETF | -1.08% | |
| 3-7 Year Treasury Bond ETF | -0.99% | |
| 1-3 Year Treasury Bond ETF | -0.53% |
Summary
The bond performance over varying terms reflects distinct economic sentiments and risk assessments. While the long-duration treasury bonds capitalize on positive interest environments momentarily, high-yield corporate bonds consistently showcase their robustness across the quarters. Investors are advised to cautiously optimize their portfolio balance, ensuring diversification while capitalizing on emerging opportunities across the markets. Sustainability and currency volatility remain pivotal as markets navigate forward. ✅
Smart Data Insight
Master the Perfect Entry & Exit for this Stock
Don't leave your profits to chance. Historically, this stock follows specific seasonal patterns that institutional traders use to maximize returns.
- ✅ Identify the "Golden Buying Window"
- ✅ Avoid high-risk correction cycles
- ✅ Backtested data from the last 20+ years