
July 16, 2026 a 12:32 pm


Bonds - Performance Analysis
📊 The bond market has shown varying levels of volatility across different periods, with short-term bonds exhibiting steadier performances compared to longer-term bonds. Economic indicators and interest rate changes are likely playing pivotal roles in influencing these performances. This analysis will delve into weekly, monthly, and quarterly bond performances, highlighting both top performers and underperformers.
Bonds Performance One Week
📈 Over the past week, short-term treasury bonds have outperformed their longer-dated counterparts, as reflected by positive returns in the 1-3 year and 3-7 year treasury bond ETFs. The 20+ year treasury bonds, on the other hand, have faced declines, indicating potential market caution towards longer-duration bonds. Interest rate expectations might have driven a preference for shorter maturities.
| Bond | Performance (%) | Performance |
|---|---|---|
| 3-7 Year Treasury Bond ETF | 0.13 | |
| 1-3 Year Treasury Bond ETF | 0.11 | |
| 7-10 Year Treasury Bond ETF | 0.08 | |
| High Yield Corporate Bond ETF | 0.07 | |
| TIPS Bond ETF | -0.04 | |
| 10-20 Year Treasury Bond ETF | -0.09 | |
| 20+ Year Treasury Bond ETF | -0.29 |
Bonds Performance One Month
📉 Over a month, bond markets have generally depicted downward trends, with longer-term treasury bond ETFs facing the most significant declines. These market movements reflect broader macroeconomic concerns and changing investor appetites for risk, possibly influenced by anticipation of rising rates.
| Bond | Performance (%) | Performance |
|---|---|---|
| High Yield Corporate Bond ETF | -0.29 | |
| 1-3 Year Treasury Bond ETF | -0.16 | |
| 3-7 Year Treasury Bond ETF | -0.42 | |
| 7-10 Year Treasury Bond ETF | -0.78 | |
| TIPS Bond ETF | -1.54 | |
| 10-20 Year Treasury Bond ETF | -1.70 | |
| 20+ Year Treasury Bond ETF | -2.24 |
Bonds Performance Three Months
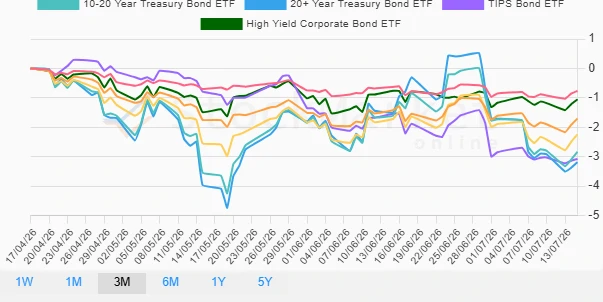
⚠️ Over the course of three months, the bond market has exhibited more pronounced negative trends, especially for longer-duration treasuries. This suggests persistent fears over potential interest rate hikes and inflationary pressures. The continued underperformance of long-term bonds compared to short-term bonds further reflects investor sentiment shifting towards minimizing duration risk.
| Bond | Performance (%) | Performance |
|---|---|---|
| High Yield Corporate Bond ETF | -1.06 | |
| 1-3 Year Treasury Bond ETF | -0.77 | |
| 3-7 Year Treasury Bond ETF | -1.71 | |
| 7-10 Year Treasury Bond ETF | -2.25 | |
| TIPS Bond ETF | -3.08 | |
| 10-20 Year Treasury Bond ETF | -2.84 | |
| 20+ Year Treasury Bond ETF | -3.19 |
Summary
💡 Overall, the bond market has reflected investor caution, especially regarding longer durations amidst potential interest rate hikes. Shorter-term bonds appear to be relatively more stable, showcasing their defensive attributes in uncertain economic conditions. Investors may favor minimizing duration risk by focusing on short to medium-term securities to navigate the prevailing market landscape proactively.
Smart Data Insight
Master the Perfect Entry & Exit for this Stock
Don't leave your profits to chance. Historically, this stock follows specific seasonal patterns that institutional traders use to maximize returns.
- ✅ Identify the "Golden Buying Window"
- ✅ Avoid high-risk correction cycles
- ✅ Backtested data from the last 20+ years