
October 15, 2026 a 12:31 pm


Bonds - Performance Analysis
📊 The bond market has experienced dynamic shifts over the recent periods. Our analysis examines the performance across various durations to determine significant trends and impacts on different bond categories. Observations include the highlighting of leaders and laggards within short-term, medium-term, and long-term periods.
Bonds Performance One Week
🗣️ Analyzing the one-week performance, the "20+ Year Treasury Bond ETF" emerged as the top performer with a significant positive shift, while the "High Yield Corporate Bond ETF" underperformed, witnessing a decline.
| Bond | Performance (%) | Performance |
|---|---|---|
| 20+ Year Treasury Bond ETF | 1.30 | |
| 10-20 Year Treasury Bond ETF | 0.92 | |
| TIPS Bond ETF | 0.29 | |
| 7-10 Year Treasury Bond ETF | 0.28 | |
| 3-7 Year Treasury Bond ETF | 0.04 | |
| 1-3 Year Treasury Bond ETF | -0.04 | |
| High Yield Corporate Bond ETF | -0.42 |
Bonds Performance One Month
📉 Over the one-month period, bonds faced broader declines, with the "20+ Year Treasury Bond ETF" exhibiting the most considerable drop. Noticeably, "1-3 Year Treasury Bond ETF" showed relative resilience.
| Bond | Performance (%) | Performance |
|---|---|---|
| 1-3 Year Treasury Bond ETF | -0.17 | |
| TIPS Bond ETF | -0.91 | |
| 3-7 Year Treasury Bond ETF | -0.66 | |
| 7-10 Year Treasury Bond ETF | -1.21 | |
| 10-20 Year Treasury Bond ETF | -1.95 | |
| High Yield Corporate Bond ETF | -2.00 | |
| 20+ Year Treasury Bond ETF | -2.26 |
Bonds Performance Three Months
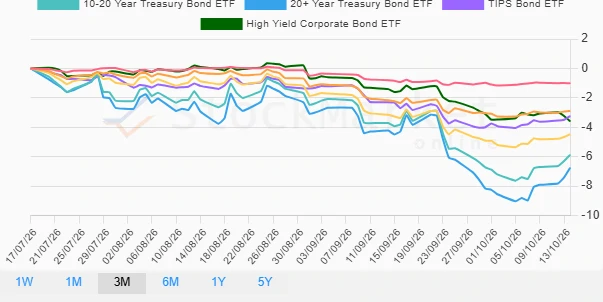
📉 The three-month analysis reveals a persistent downturn trend, predominately led by the pronounced decline of long-term bonds, particularly the "20+ Year Treasury Bond ETF" suffering the deepest loss.
| Bond | Performance (%) | Performance |
|---|---|---|
| 1-3 Year Treasury Bond ETF | -1.01 | |
| 3-7 Year Treasury Bond ETF | -2.89 | |
| TIPS Bond ETF | -3.24 | |
| High Yield Corporate Bond ETF | -3.60 | |
| 7-10 Year Treasury Bond ETF | -4.48 | |
| 10-20 Year Treasury Bond ETF | -5.88 | |
| 20+ Year Treasury Bond ETF | -6.76 |
Summary
✅ In conclusion, the bond market's recent performances reflect increased volatility, notably within longer-term bonds that were most affected. Short-term bonds exhibited less instability, suggesting potential avenues for risk-averse strategies. Investors are advised to monitor interest rate trends closely as they recalibrate portfolios to optimize exposures based on anticipated market shifts. 🔍
Smart Data Insight
Master the Perfect Entry & Exit for this Stock
Don't leave your profits to chance. Historically, this stock follows specific seasonal patterns that institutional traders use to maximize returns.
- ✅ Identify the "Golden Buying Window"
- ✅ Avoid high-risk correction cycles
- ✅ Backtested data from the last 20+ years