
May 14, 2026 a 12:31 pm


Bonds - Performance Analysis
Understanding bond performance across various timelines provides key insights into market trends and investment strategies. The current data highlights distinct patterns in short to long-duration bonds, showcasing the necessity for a strategic approach influenced by macroeconomic indicators and interest rate forecasts. The results outline the need for investors to stay alert and adaptive to ongoing fluctuations.
Bonds Performance One Week
📊 The one-week analysis reflects a modest volatility with TIPS and High Yield Corporate Bonds leading the short-term market. A negative trend is observed across most Treasury Bond ETFs, indicating a cautious investor sentiment influenced likely by recent macroeconomic news.
| Bond | Performance (%) | Performance |
|---|---|---|
| TIPS Bond ETF | 0.08% | |
| High Yield Corporate Bond ETF | 0.06% | |
| 1-3 Year Treasury Bond ETF | -0.04% | |
| 3-7 Year Treasury Bond ETF | -0.25% | |
| 7-10 Year Treasury Bond ETF | -0.42% | |
| 10-20 Year Treasury Bond ETF | -0.78% | |
| 20+ Year Treasury Bond ETF | -0.99% |
Bonds Performance One Month
📉 The one-month performance reveals significant bearish trends, with longer-duration Treasury Bonds facing substantial declines. The High Yield Corporate Bond ETF, although negative, shows relative resilience in contrast to government bonds.
| Bond | Performance (%) | Performance |
|---|---|---|
| TIPS Bond ETF | -0.38% | |
| 1-3 Year Treasury Bond ETF | -0.41% | |
| High Yield Corporate Bond ETF | -0.74% | |
| 3-7 Year Treasury Bond ETF | -1.05% | |
| 7-10 Year Treasury Bond ETF | -1.54% | |
| 10-20 Year Treasury Bond ETF | -2.32% | |
| 20+ Year Treasury Bond ETF | -2.78% |
Bonds Performance Three Months
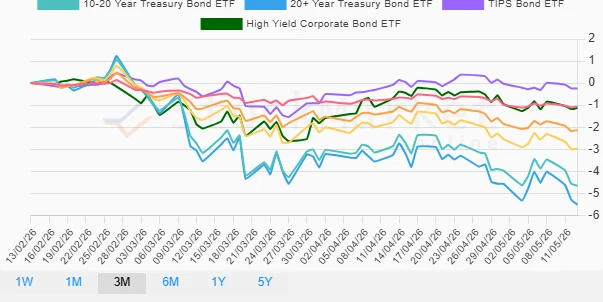
📈 Over the three-month period, the data signifies continued downward pressure, particularly on long-term bonds, highlighting reactionary measures to prevailing interest rate changes. TIPS have shown the smallest degree of loss, suggesting investor rotation into inflation-protected instruments.
| Bond | Performance (%) | Performance |
|---|---|---|
| TIPS Bond ETF | -0.24% | |
| 1-3 Year Treasury Bond ETF | -1.06% | |
| High Yield Corporate Bond ETF | -1.13% | |
| 3-7 Year Treasury Bond ETF | -2.13% | |
| 7-10 Year Treasury Bond ETF | -2.99% | |
| 10-20 Year Treasury Bond ETF | -4.66% | |
| 20+ Year Treasury Bond ETF | -5.51% |
Summary
🗣️ The analyzed periods emphasize a challenging bond market environment, significantly impacted by potential interest rate hikes and ongoing inflationary pressures. Long-duration bonds have seen the most pronounced losses, underscoring increased sensitivity to interest rate fluctuations. TIPS ETF has displayed relative resilience, indicating a possible strategic asset realignment for protecting against inflation. Investors would benefit from a diversified approach that takes into consideration further rate adjustments and potential monetary policy changes.
Smart Data Insight
Master the Perfect Entry & Exit for this Stock
Don't leave your profits to chance. Historically, this stock follows specific seasonal patterns that institutional traders use to maximize returns.
- ✅ Identify the "Golden Buying Window"
- ✅ Avoid high-risk correction cycles
- ✅ Backtested data from the last 20+ years