
November 12, 2026 a 12:32 pm


Bonds - Performance Analysis
The bond market exhibits inherent fluctuations over short, medium, and long durations. Recent data reveals divergent performances across different bond types. An understanding of these dynamics is crucial for optimizing bond portfolios and identifying both risks and opportunities. Investors are advised to recognize sector-specific trends and adapt their strategies accordingly.
Bonds Performance One Week 📊
| Bond | Performance (%) | Performance |
|---|---|---|
| High Yield Corporate Bond ETF | 0.09% | |
| 1-3 Year Treasury Bond ETF | -0.44% | |
| TIPS Bond ETF | -0.95% | |
| 3-7 Year Treasury Bond ETF | -0.92% | |
| 7-10 Year Treasury Bond ETF | -1.13% | |
| 20+ Year Treasury Bond ETF | -1.23% | |
| 10-20 Year Treasury Bond ETF | -1.27% |
Bonds Performance One Month 📊
| Bond | Performance (%) | Performance |
|---|---|---|
| 20+ Year Treasury Bond ETF | 3.27% | |
| 10-20 Year Treasury Bond ETF | 2.67% | |
| 7-10 Year Treasury Bond ETF | 1.59% | |
| 3-7 Year Treasury Bond ETF | 0.74% | |
| TIPS Bond ETF | 0.68% | |
| High Yield Corporate Bond ETF | 0.37% | |
| 1-3 Year Treasury Bond ETF | 0.18% |
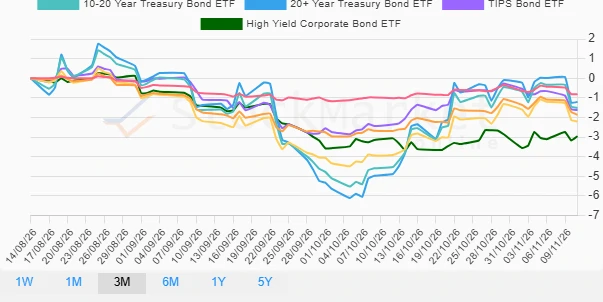
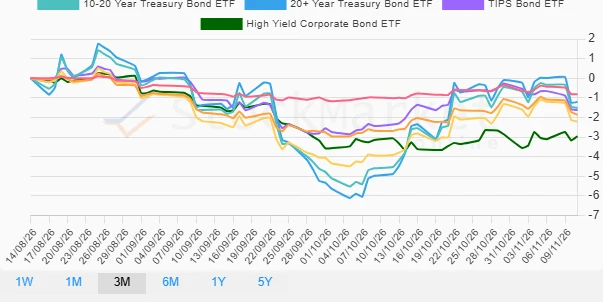
Bonds Performance Three Months 📊
| Bond | Performance (%) | Performance |
|---|---|---|
| High Yield Corporate Bond ETF | -2.96% | |
| 7-10 Year Treasury Bond ETF | -2.21% | |
| 3-7 Year Treasury Bond ETF | -1.87% | |
| TIPS Bond ETF | -1.62% | |
| 10-20 Year Treasury Bond ETF | -1.52% | |
| 20+ Year Treasury Bond ETF | -1.21% | |
| 1-3 Year Treasury Bond ETF | -0.82% |
Summary 💡
The observed variations across different timeframes underscore the dynamic nature of bond investments. Over the last month, longer-dated bonds exhibited notable strong performances, suggesting a market shift towards duration plays, whereas shorter durations faced lesser gains. Conversely, the 3-month view highlights a pronounced underperformance in high-yield corporates, potentially attributed to credit concerns. Investors should maintain vigilance and potentially adjust their portfolios to accommodate for duration and credit quality shifts. Continuous monitoring of market indicators and interest rate forecasts remains essential for strategic positioning.
Smart Data Insight
Master the Perfect Entry & Exit for this Stock
Don't leave your profits to chance. Historically, this stock follows specific seasonal patterns that institutional traders use to maximize returns.
- ✅ Identify the "Golden Buying Window"
- ✅ Avoid high-risk correction cycles
- ✅ Backtested data from the last 20+ years