
June 11, 2026 a 12:32 pm


Bonds - Performance Analysis
Bond markets have experienced a tumultuous period, marked by negative returns across various asset classes. This analysis provides an in-depth look at weekly, monthly, and quarterly performance, identifying prevailing trends and their potential implications. With geopolitical tensions and economic uncertainties, investors are grappling with volatility, necessitating a reevaluation of risk-reward strategies in fixed income portfolios.
Bonds Performance One Week 📊
| Bond | Performance (%) | Performance |
|---|---|---|
| 1-3 Year Treasury Bond ETF | -0.11 | |
| 3-7 Year Treasury Bond ETF | -0.28 | |
| 7-10 Year Treasury Bond ETF | -0.46 | |
| 10-20 Year Treasury Bond ETF | -0.67 | |
| 20+ Year Treasury Bond ETF | -0.72 | |
| TIPS Bond ETF | -0.52 | |
| High Yield Corporate Bond ETF | -0.45 |
Bonds Performance One Month 📈
| Bond | Performance (%) | Performance |
|---|---|---|
| 20+ Year Treasury Bond ETF | -0.09 | |
| 1-3 Year Treasury Bond ETF | -0.26 | |
| 10-20 Year Treasury Bond ETF | -0.33 | |
| High Yield Corporate Bond ETF | -0.51 | |
| 3-7 Year Treasury Bond ETF | -0.58 | |
| 7-10 Year Treasury Bond ETF | -0.66 | |
| TIPS Bond ETF | -1.72 |
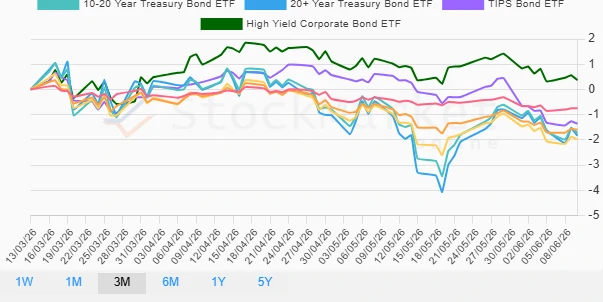
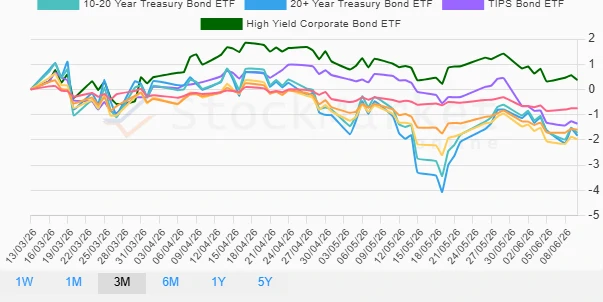
Bonds Performance Three Months 📉
| Bond | Performance (%) | Performance |
|---|---|---|
| High Yield Corporate Bond ETF | 0.37 | |
| TIPS Bond ETF | -1.36 | |
| 1-3 Year Treasury Bond ETF | -0.75 | |
| 10-20 Year Treasury Bond ETF | -1.72 | |
| 20+ Year Treasury Bond ETF | -1.83 | |
| 3-7 Year Treasury Bond ETF | -1.60 | |
| 7-10 Year Treasury Bond ETF | -1.98 |
Summary ✅
The bond market landscape remains challenging, with pressures from rising interest rates and macroeconomic concerns. While short-duration bonds show smaller declines, long-duration assets face significant headwinds. Despite some relief in high-yield corporate bonds, TIPS remain particularly under pressure due to inflation expectations. Investors should focus on balancing duration risk with yield opportunities, carefully monitoring economic indicators and policy shifts to guide future investment decisions.
Smart Data Insight
Master the Perfect Entry & Exit for this Stock
Don't leave your profits to chance. Historically, this stock follows specific seasonal patterns that institutional traders use to maximize returns.
- ✅ Identify the "Golden Buying Window"
- ✅ Avoid high-risk correction cycles
- ✅ Backtested data from the last 20+ years