April 09, 2026 a 12:32 pm


Bonds - Performance Analysis
📊 The bond market has displayed varied performances across different durations, reflecting shifting economic conditions and investor sentiment. Short-term performance benefits from market stability, while longer durations appear pressured by interest rate changes and macroeconomic uncertainties. It is vital to identify and adapt to these market movements for informed investment decisions.
Bonds Performance One Week
📈 Over the past week, bonds experienced marginal positive performance spearheaded by the High Yield Corporate Bond ETF, indicating investor confidence in higher risk-reward scenarios. Treasury Bonds witnessed moderate gains, suggesting market stability in short-term government bonds.
| Bond | Performance (%) | Performance |
|---|---|---|
| High Yield Corporate Bond ETF | 0.80% | |
| 10-20 Year Treasury Bond ETF | 0.24% | |
| 7-10 Year Treasury Bond ETF | 0.21% | |
| 3-7 Year Treasury Bond ETF | 0.17% | |
| 20+ Year Treasury Bond ETF | 0.15% | |
| TIPS Bond ETF | 0.09% | |
| 1-3 Year Treasury Bond ETF | 0.07% |
Bonds Performance One Month
📉 Over the past month, bond performance has been largely negative with prolonged maturities experiencing the most significant downturns. A modest positive return from High Yield Corporate Bond ETF highlights selective optimism in corporate securities amidst broader bond market challenges.
| Bond | Performance (%) | Performance |
|---|---|---|
| High Yield Corporate Bond ETF | 0.23% | |
| TIPS Bond ETF | -0.29% | |
| 1-3 Year Treasury Bond ETF | -0.37% | |
| 3-7 Year Treasury Bond ETF | -0.73% | |
| 7-10 Year Treasury Bond ETF | -1.00% | |
| 10-20 Year Treasury Bond ETF | -1.41% | |
| 20+ Year Treasury Bond ETF | -1.50% |
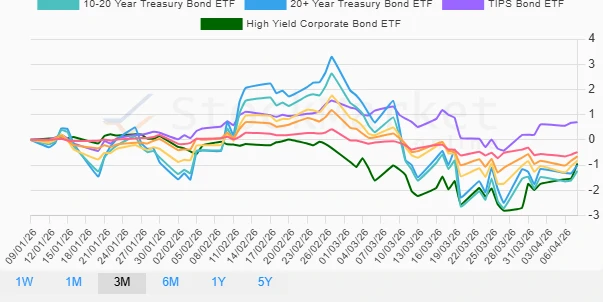
Bonds Performance Three Months
🔍 Over the three-month period, most bond categories record sustained negative trends, heavily influenced by interest rate fluctuation concerns. TIPS Bond ETF, however, managed to secure a positive return indicating inflation-aware protection strategies are gaining traction.
| Bond | Performance (%) | Performance |
|---|---|---|
| TIPS Bond ETF | 0.70% | |
| 3-7 Year Treasury Bond ETF | -0.66% | |
| 1-3 Year Treasury Bond ETF | -0.49% | |
| 20+ Year Treasury Bond ETF | -1.01% | |
| High Yield Corporate Bond ETF | -0.95% | |
| 7-10 Year Treasury Bond ETF | -0.83% | |
| 10-20 Year Treasury Bond ETF | -1.24% |
Summary
💡 The bond market reflects a complex interplay between economic variables and investor behavior. Short-term growth shown in corporate bonds and TIPS indicate focused investor strategies balancing risk and inflation hedge. Nonetheless, the broader negative trend in Treasury Bonds during one and three months requires vigilance as interest rates and economic forecasts evolve.
Smart Data Insight
Master the Perfect Entry & Exit for this Stock
Don't leave your profits to chance. Historically, this stock follows specific seasonal patterns that institutional traders use to maximize returns.
- ✅ Identify the "Golden Buying Window"
- ✅ Avoid high-risk correction cycles
- ✅ Backtested data from the last 20+ years