
January 08, 2026 a 12:32 pm

Bonds - Performance Analysis
📊 The bond market performance over varying time frames provides critical insights into market movements and investor sentiment. By analyzing periods over one week, one month, and three months, we can identify trends impacting different segments, from short-term Treasuries to high-yield corporate bonds. This data also highlights both opportunities and potential risks for investors navigating the current economic landscape.
Bonds Performance One Week
📈 Over the past week, the bond market showed a positive trend with the 20+ Year Treasury Bond ETF leading the charge. Strong performances were also noted in mid-to-long-term treasuries as investors sought stability amidst market volatility. This optimism indicates a solid appetite for longer-duration securities.
| Bond | Performance (%) | Performance |
|---|---|---|
| 20+ Year Treasury Bond ETF | 0.71% | |
| 10-20 Year Treasury Bond ETF | 0.60% | |
| High Yield Corporate Bond ETF | 0.31% | |
| TIPS Bond ETF | 0.30% | |
| 7-10 Year Treasury Bond ETF | 0.34% | |
| 3-7 Year Treasury Bond ETF | 0.18% | |
| 1-3 Year Treasury Bond ETF | 0.09% |
Bonds Performance One Month
📈 The past month revealed a stable to modest performance across shorter-duration treasuries. However, the High Yield Corporate Bond ETF outperformed, showcasing a strong return of 0.53%. On the contrary, the 20+ Year Treasury Bond ETF exhibited a decline, signifying possible concerns over long-term interest rate movements.
| Bond | Performance (%) | Performance |
|---|---|---|
| High Yield Corporate Bond ETF | 0.53% | |
| 10-20 Year Treasury Bond ETF | 0.44% | |
| 3-7 Year Treasury Bond ETF | 0.39% | |
| 7-10 Year Treasury Bond ETF | 0.38% | |
| 1-3 Year Treasury Bond ETF | 0.20% | |
| TIPS Bond ETF | 0.14% | |
| 20+ Year Treasury Bond ETF | -0.19% |
Bonds Performance Three Months
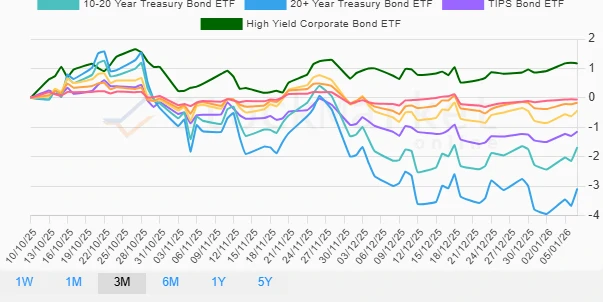
📉 The quarterly performance reflects significant volatility and market adjustments, with the 20+ Year Treasury Bond ETF declining sharply by -3.09%. This could highlight investor caution regarding long-term prospects. In contrast, the High Yield Corporate Bond ETF showed resilience, posting a 1.17% gain, underscoring a continuous interest in higher-risk, higher-return investments.
| Bond | Performance (%) | Performance |
|---|---|---|
| High Yield Corporate Bond ETF | 1.17% | |
| 1-3 Year Treasury Bond ETF | -0.06% | |
| 3-7 Year Treasury Bond ETF | -0.17% | |
| 7-10 Year Treasury Bond ETF | -0.44% | |
| TIPS Bond ETF | -1.15% | |
| 10-20 Year Treasury Bond ETF | -1.68% | |
| 20+ Year Treasury Bond ETF | -3.09% |
Summary
💡 The bond market over the analyzed periods demonstrates a varied performance landscape. Short-term treasuries have remained relatively stable, indicating cautious investor sentiment. Longer-dated bonds, particularly the 20+ Year Treasury, have faced significant declines over the quarter, raising potential concerns on future rate hikes or economic shifts. However, high-yield corporate bonds continue to attract interest, offering compelling returns amidst heightened risk. Investors should carefully weigh the potential benefits against the inherent risks, focusing on diversification and strategic duration management.
Smart Data Insight
Master the Perfect Entry & Exit for this Stock
Don't leave your profits to chance. Historically, this stock follows specific seasonal patterns that institutional traders use to maximize returns.
- ✅ Identify the "Golden Buying Window"
- ✅ Avoid high-risk correction cycles
- ✅ Backtested data from the last 20+ years