May 07, 2026 a 12:31 pm


Bonds - Performance Analysis
In the current financial landscape, bonds have shown varied performance across different time horizons. This analysis delves into the recent trends of bond ETFs over weekly, monthly, and quarterly periods, identifying key performers and those that have lagged behind. Understanding these shifts can provide valuable insights for portfolio strategy adjustments.
📊 Bonds Performance One Week
The past week has seen a mixed performance in bond ETFs, with longer-term treasuries outperforming the shorter durations. Notably, the 20+ Year Treasury Bond ETF posted the highest gains, indicating investor confidence in longer-dated bonds amidst an uncertain economic outlook.
| Bond | Performance (%) | Performance |
|---|---|---|
| 20+ Year Treasury Bond ETF | 0.54 | |
| 10-20 Year Treasury Bond ETF | 0.45 | |
| 7-10 Year Treasury Bond ETF | 0.03 | |
| 3-7 Year Treasury Bond ETF | -0.14 | |
| 1-3 Year Treasury Bond ETF | -0.22 | |
| High Yield Corporate Bond ETF | -0.27 | |
| TIPS Bond ETF | -0.37 |
📊 Bonds Performance One Month
Over the past month, High Yield Corporate Bond ETFs appeared more favorable as the only segment posting positive returns. The traditional Treasury Bond ETFs faced downward pressure, reflecting market volatility and shifting investor sentiments.
| Bond | Performance (%) | Performance |
|---|---|---|
| High Yield Corporate Bond ETF | 0.55 | |
| TIPS Bond ETF | 0.22 | |
| 1-3 Year Treasury Bond ETF | -0.06 | |
| 3-7 Year Treasury Bond ETF | -0.19 | |
| 7-10 Year Treasury Bond ETF | -0.25 | |
| 10-20 Year Treasury Bond ETF | -0.28 | |
| 20+ Year Treasury Bond ETF | -0.63 |
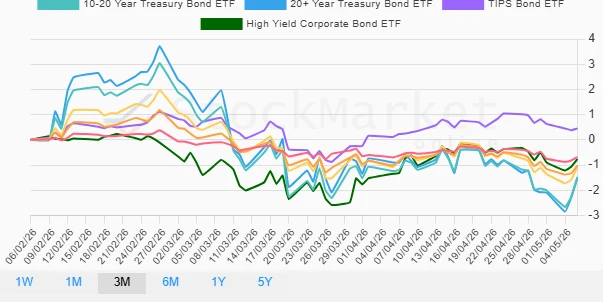
📊 Bonds Performance Three Months
The three-month outlook reveals a challenging environment for bonds with significant negative returns across most categories. TIPS Bond ETF stands out as a relative safe haven with its positive gains amidst broader declines.
| Bond | Performance (%) | Performance |
|---|---|---|
| TIPS Bond ETF | 0.45 | |
| High Yield Corporate Bond ETF | -0.77 | |
| 1-3 Year Treasury Bond ETF | -0.69 | |
| 3-7 Year Treasury Bond ETF | -1.02 | |
| 7-10 Year Treasury Bond ETF | -1.08 | |
| 10-20 Year Treasury Bond ETF | -1.48 | |
| 20+ Year Treasury Bond ETF | -1.54 |
🔍 Summary
The bonds landscape remains volatile, driven by macroeconomic uncertainty and interest rate dynamics. While short-term fluctuations offer opportunities in long-dated Treasury Bonds, recent months underscore the risks inherent in a tightening market. Investors should consider a balanced approach, leveraging TIPS for inflation protection and selective high-yield exposures to enhance overall yield.
Smart Data Insight
Master the Perfect Entry & Exit for this Stock
Don't leave your profits to chance. Historically, this stock follows specific seasonal patterns that institutional traders use to maximize returns.
- ✅ Identify the "Golden Buying Window"
- ✅ Avoid high-risk correction cycles
- ✅ Backtested data from the last 20+ years